I am not a fan of metrics. Wait. That’s not right. Let me try again. I am not a fan of singular metrics that stand by themselves. Nope. That’s still not right. I loathe singular metrics that stand by themselves as if they themselves are solutions to problems. Ok. That works. Let me explain.
Last week, I told a tale of a secret passageway into DevOps called Mean Time To Resolution (MTTR) and explained how the introduction of this one tiny metric can magically open the door to all things DevOps. Given that MTTR and cycle time are inextricably linked, any shop that is serious about MTTR will sooner or later find itself using DevOps practices.
Metrics + Crafty Humans = Doom
This is very different than two weeks ago when I told a different tale. A tale of how the very origins and roots of DevOps gives the DevOps movement an opportunity to do what ITIL could not; Change the relationship between business and IT. In the telling of this tale, rife with philosophical terms like reductionism and formalism, I quoted a brilliant English economist, Charles Goodheart, who noted that “when a measure becomes a target, it ceases to be a good measure”. Goodheart discovered that “any observed statistical regularity will tend to collapse once pressure is placed upon it for control purposes.” The layman’s explanation is that humans are crafty little buggers and will find ways to artificially hit any target because the quantitative systems can always be rigged.
So what is a DevOps voyager to do? Introduce the metric, get the change, and then proceed to watch devops die a slow death? No, my fellow DevOps devotees, that shall not be our fate. We can avoid this fate by knowing that halfway down the path of the secret passageway known as MTTR, there is a fork!


More Metrics to the Rescue!
Instead of introducing and presenting a flat and un-nuanced view of MTTR by itself, we can get a little crafty ourselves and find an appropriate hedge against Goodheart’s lay and instead present a weighted view of MTTR with a few other key metrics to allow for a more sophisticated view of the health of the IT factory floor.
Apply Weighted Averages – Weight the MTTR of defects and their associated resolutions by priority to intentionally skew the measurement towards the highest priority defects. Clinging to an absolute view of defect free software doesn’t work for a large code base with limited funding and time (aside from being scientifically impossible to achieve via godels proof)
Track Inbound Defect Counts – Track and present the inbound defect count, keeping the inbound defect count low is important, but pushing it to zero is more likely to be indicative of a shop that is more concerned with perfection than throughput
Track Outbound Defect Counts – Track and present the defect close count. keeping a negative inbound-outbound differential is a sign of a shop that is arcing in the right direction. Several weeks or months of positive differential is a warning sign that a quality mindset is slipping into dangerous territory.
Track Backlog Defect Counts – Track and present the count of defects in the backlog. A backlog of zero can be incredibly hard to maintain in a large enterprise with a large code base. In my experience 20 and 50 have been ominous numbers. Any more than 20 defects in an application and the backlog starts to become a fearsome beast that can only be tamed by stopping the factory. Any more than 50 and the incremental additions of any new defect seem trivial.
Track The Age Defects – Tracking the average age of defects in the backlog is critical for any presentation of MTTR. A spike in MTTR can actually be a good thing if it represents a wave of old defects being cleared from the back of the backlog.
Resist The Urge to Simplify
A five part metric begs the question of an balanced score card approach with a grading formula and despite my belief in the value of this tactic for availability and performance dashboards, I advise you to strongly resist the temptation to apply it here (otherwise, we are right back where we started with Goodheart’s Law. Damn you crafty humans!).
If you decide to bring the magical metric of MTTR into your shop, this type of reporting may be one area where starting small is quite possibly worse than doing nothing. Without the nuanced view, true visibility into the health of the shop isn’t possible. Worse than that, a flat view of just MTTR has the potential to mask real problems and raise false ones.
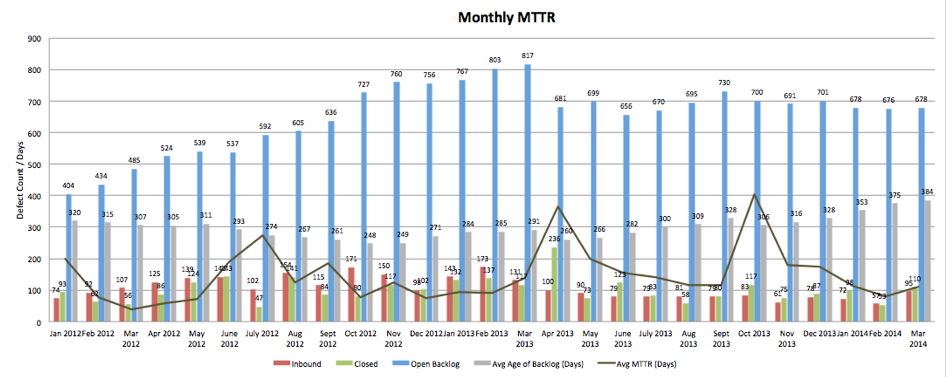
When you pull all of the metrics together in a single view, like in the above graphic, the real message becomes clear. The health of the factory floor isn’t tied up in a neat little bow by a single number. It isn’t even made perfectly clear by three, four or five numbers. The real health becomes clear in the trend. Is your shop doing better week over week? Month over month? Getting better every day is the name of the game, and MTTR (with a few other metrics) can be a lever that moves your IT world.