Tag: application observability

  • Does Shift Left Matter to SREs?

    Does Shift Left Matter to SREs?

    If you’re a software engineer, you’ve likely heard all about shift left, a practice that can streamline certain aspects of software development.

    But shift left isn’t just for developers. It can be equally valuable for site reliability engineers (SREs). Although the main mission of SREs is ensuring the reliability of software after it has been deployed rather than actually developing software, encouraging shift left practices as part of a software development strategy can nonetheless make it easier to optimize reliability.

    To prove the point, here’s an overview of what shift left means and why it matters for SREs.

    What Does Shift Left Mean?

    Shift left is the detection of application problems early in the software development process. The core idea behind shift left is that instead of waiting until just before deployment to test software for bugs, security issues or other problems, teams should begin the testing process as early as possible. In other words, they should shift some testing to the “left” of the software development life cycle instead of testing only in the middle—hence the term “shift left.”

    In so doing, they can detect problems early in the development process, at which point they are typically easier to resolve. If you don’t catch a performance, reliability or security bug until just before you plan to push your application release into production, you may have to overhaul a large part of your codebase to fix the issue. In many cases, you’ll have to change not just the specific code that triggered the bug, but also other code that depends on or integrates with the buggy code. But by finding buggy code early, developers can often fix the problem with minimal adjustments to the application as a whole.

    Shift left is a high-level concept, and it can be implemented in multiple ways. In some cases, developers may start running performance tests on new code right after they write it, even if it has not yet been integrated into the main codebase. In other cases, shift left testing could mean compiling some parts of the codebase in order to run tests against it before the application as a whole is built and tested in a dev/testing environment. Either way, the result is a testing process that begins earlier than it would under a conventional approach.

    Importantly, shift left doesn’t mean that teams skip the tests that they would normally perform just prior to deployment. Those tests, which are important for catching bugs that materialize only when testing the application as a whole rather than individual parts of it, typically still happen as part of a shift left strategy. Thus, shift left means that testing begins earlier and coincides with a broader portion of the overall development pipeline, not that testing is simply shifted to the beginning of the pipeline at the expense of mid-pipeline tests.

    Shift Left and SREs

    Again, the main job of SREs is to manage the reliability of systems. They may spend part of their days working alongside software engineers to help devise architectures and coding strategies that maximize the resiliency of applications against reliability and performance issues. But SREs also devote much of their time to managing what happens post-deployment. They use monitoring and observability tools to detect problems that arise in production environments. They then take the lead in responding to them.

    In that sense, SREs may not seem to have much to gain from shift left. Shift left is a strategy that aligns with software development first and foremost, and software development is not the core focus of SREs.

    Nonetheless, a shift-left strategy can help SREs do their jobs better, for several reasons:

    • Fewer problems in production: Most obviously, shift left reduces the rate at which reliability issues reach production environments. In turn, it minimizes the number of incidents SREs need to respond to.
    • Optimizing software pre-deployment: By exposing reliability issues early in the development process, shift left is one way for SREs to acquire the insights they need to collaborate with developers on building reliability into applications. Shift left could highlight buggy dependencies or suboptimal architectural patterns, for example, which SREs can encourage developers to address.
    • Granular reliability insights: Because shift left is a great way to trace software problems to the specific code that triggers them, it provides highly granular visibility into reliability. It can help SREs find the weakest links within an application’s codebase or architecture. These weak spots can be harder to detect when monitoring or observing an application as a whole.

    How SREs can Follow the Shift Left Methodology

    Because the implementation of shift left practices is a task that ultimately falls to developers, SREs need to work closely with development teams (and DevOps engineers, if they exist in the organization) to make shift left happen.

    The first step in that process is to get buy-in for shift left among developers. SREs can do this by highlighting the ways in which shift left can streamline the work of developers and reduce the complexity of fixing bugs. That’s important to communicate because it ensures that developers understand that shift left benefits everyone, not just SREs.

    SREs should also work with developers to identify the best approaches and practices to implementing shift left. A key factor to consider here is where reliability problems most often arise, and how shift left can help to detect them earlier. If most performance problems stem from code written by individual developers, for instance, testing code as soon as it is generated may be the best way to detect problems early on. In contrast, in situations where performance issues are triggered most often by environment configurations, the ability to test applications early under different environment variables could be the best way to surface issues early in the development process.

    Finally, SREs should partner with developers to respond to the issues that shift left reveals. After all, while developers typically don’t pay close attention to what happens post-deployment, SREs have a special ability to understand how problems in development translate to problems in production. SREs may therefore be able to help developers identify the most effective way to fix bugs based on production environment requirements, even if it’s not the quickest or simplest way.

    Why SREs Need to Shift Left, Too

    Although the shift left methodology has not traditionally been closely associated with SRE, shift left is a crucial tool in the SRE toolbox. By helping teams to detect reliability issues when they are easier to resolve, shift left puts SREs in a stronger position to maximize the overall reliability of applications. At the same time, it reduces the number of production environment issues that SREs have to manage.

  • 5 App Modernization Best Practices

    5 App Modernization Best Practices

    An organization’s digital transformation is ineffectual if it doesn’t bring out the best from its applications. This is a near-universal concern since most enterprises still have core applications that are architected primarily to work in legacy IT landscapes in an on-premises dedicated environment, slowing down IT and business performance, stymieing innovation and increasing vulnerability to risk. Businesses are paying the price of their technical debt by forsaking agility, adaptability and competitiveness. That’s bad enough in regular times; in a post-pandemic scenario, this can have devastating consequences. 

    Acquiring a few cloud-native applications that are not integrated with existing systems is of limited value and, at best, provides just part of the answer. On the other hand, overhauling the legacy application landscape is usually out of the question. The only reasonable solution, then, is application modernization. But where does an enterprise begin?

    Pick and Shift

    A great place to start is by examining existing applications. Understanding every application’s function, performance and issues and what it can gain from modernization will help to establish a ‘universal set’ to pick from. The candidates for modernization can be prioritized based on technology factors—for example, when the architecture adds cost, vulnerability or complexity—as well as business considerations, such as compromised agility or value potential. Finally, the enterprise needs to weigh the potential benefits, especially ROI, against the difficulty of modernization.  

    Typically, the biggest, most important applications at the core of the enterprise are the hardest to modernize. But without their involvement, the transformation will most often be incomplete. Rather than lifting and shifting these monolithic applications and their vast data to the cloud, the enterprise can enclose them in an API layer to connect them to all the other applications that are being migrated as well as any new applications that are deployed. Using APIs to expose the functions and data of a legacy core system, such as ERP, allows it to be widely used, reused and modified, as well as leveraged to build new solutions and services. 

    Split Into Microservices

    Refactoring is a useful way of modernizing legacy applications that involves breaking them into microservices, which are then connected to cloud infrastructure such as Docker or Kubernetes. These microservices, which are loosely coupled, can be ‘called’ and scaled individually. Since refactoring requires significant rewriting and restructuring of the code, it is best done progressively over several iterations to make sure everything is functioning properly.  

    Provide Full-Stack Visibility 

    Even when an application is modernized into microservices on the cloud, it needs to communicate with other legacy systems in the enterprise. The problem is that now there are more services and environments to monitor and secure, not to mention single points of failure, which not only increases complexity but also denies the enterprise full-stack visibility. But visibility across environments—edge to core (on-premises) to cloud—is imperative for success. This is achieved by ensuring that the modernized applications fit within the organization’s data fabric. The enterprise needs to capture data across the stack, from end to end, and process it in real-time to have an uninterrupted view of the performance and availability  of its applications.

    Modernize the Process Landscape

    A perfectly executed application modernization program can fail to deliver results if the surrounding requirements—for example, planning and meeting quality standards—are not met. Legacy processes can be a drag on modernization efforts. It is therefore necessary to address this issue by rearchitecting processes to fit a more automated setup by supporting code developers with teammates who understand the business requirements, adopt best practices and follow the example of successful digital natives. 

    Track Performance Metrics

    Going back to the point about visibility; enterprises need to establish key metrics to track so they can monitor the performance of applications right down to the code level. And it’s not just applications—the entire infrastructure, from cloud to databases to networks, needs to be tracked continuously to identify problems before they blow up. The performance of applications needs to be compared with the corresponding pre-modernization values to understand the benefits as well as identify areas needing optimization.

    Balance and Act

    Application modernization approaches range from rehosting and refactoring to rearchitecting and replacing, which are progressively costlier and riskier, but also progressively more impactful. Enterprises need to decide what’s best for them based on considerations of effort, cost, risk and result. While some enterprises may go slower than others, eventually they will have to modernize all their applications to be competitive and meet their customers’ needs in the most effective way.

  • CNCF Advances OpenTelemetry Initiative

    CNCF Advances OpenTelemetry Initiative

    The Technical Oversight Committee (TOC) of the Cloud Native Computing Foundation (CNCF) has voted to accept OpenTelemetry as an incubating project as part of an ongoing effort to simplify instrumentation of software using open source agent software.

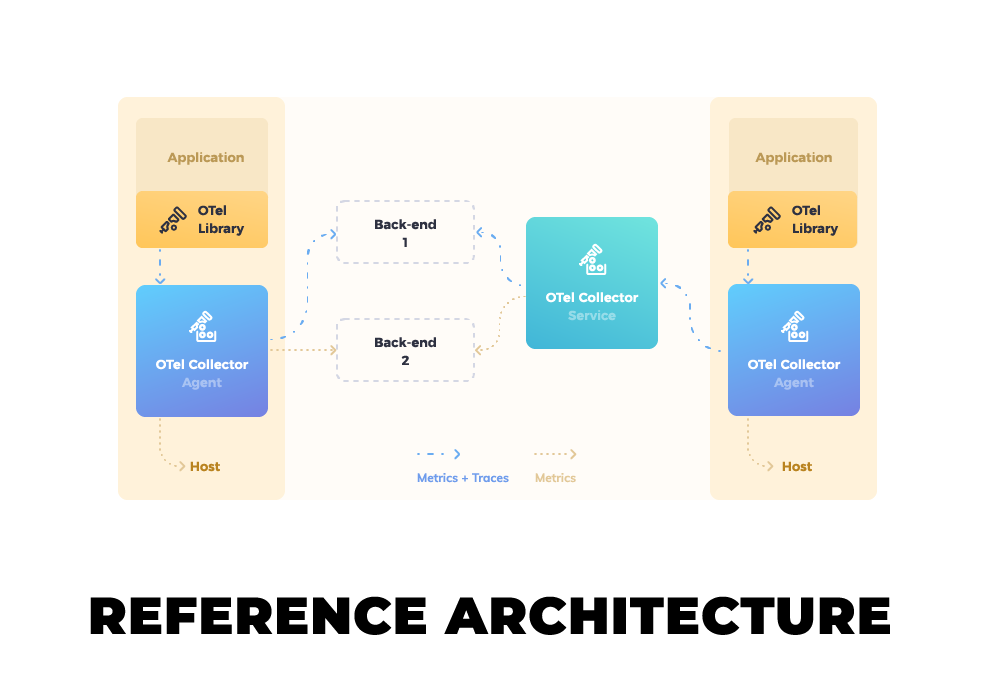
    OpenTelemetry is a collection of tools, application programming interfaces (APIs) and software development kits (SDKs) that can be employed to collect metrics, logs and traces that make it simpler to determine the root cause of an application issue.

    At its core, OpenTelemetry is based on an OpenTelemetry Protocol (OTLP) specification that describes the encoding, transport and delivery mechanism of telemetry data gathered from sources, intermediate nodes and backend platforms. An OpenTelemetry Collector provides a vendor-agnostic implementation for receiving, processing and exporting telemetry data. APIs and SDKs that make it possible to instrument applications are available for 11 different programming languages.

    Previously a sandbox-level project within the CNCF, the next step would be for OpenTelemetry to become a graduated level project alongside other open source offerings such as Kubernetes and Prometheus, a platform used to monitor IT environments.

    The OpenTelemetry project was created via the merger of the OpenCensus and OpenTracing projects in May 2019. Since then more than 500 developers from 220 companies, including Amazon, Dynatrace, Google, Honeycomb, Lightstep, Microsoft, Splunk and Uber have contributed to the project.

    Most providers of observability platforms have at least signaled their intent to support OpenTelemetry as an alternative to proprietary agent software they had previously created to collect metrics, logs and traces.

    Ben Sigelman, one of the co-creators of both OpenTracing and OpenTelemetry and CEO of Lightstep, said different elements of the OpenTelemetry project are at varying stages of maturity. As such, support for the elements of the project are being added to platforms depending on the degree to which a vendor has confidence in, for example, the ability of OpenTelemetry agent software to collect logs.

    Liz Fong-Jones, principal developer advocate for Honeycomb.io, a provider of an observability platform, said that, in time, most observability platforms will support all the elements of the OpenTelemetry initiative to reduce their own engineering and support costs. In time, those savings will be passed on to organizations that will be able to instrument applications more affordably, she noted.

    It may take a while longer for OpenTelemetry to be widely employed, but the faster organizations transition to microservices-based applications the more pressing the need for open source telemetry software becomes. The dependencies that exist between all the microservices that make up multiple applications will be unmanageable without some form of telemetry. The challenge organizations face is finding an affordable way to instrument all those microservices.

    Of course, organizations have been instrumenting applications for decades. However, the time, effort and cost associated with instrumentation have tended to limit its use to only an organization’s most mission-critical applications. The issue now is that not only do microservices-based applications require instrumentation to manage them but in the age of digital transformation the percentage of applications deemed mission-critical is also steadily rising.

  • Grafana Labs Update Aims to Simplify Observability

    Grafana Labs Update Aims to Simplify Observability

    Grafana Labs today released an update to the open source Grafana project that adds a viewer that simplifies tracking the path of a single request through a distributed system.

    Version 7.0 also adds a plug-in for Amazon CloudWatch Logs along with support for Apache Arrow, a unified data and plugin framework that promises to make it easier to build plug-ins for the analytics and monitoring tools that are widely employed in DevOps environments to provide observability.

    The latest release also adds a range of automatic rendering options for a variety of formats, including tables and non-time-series charts alongside panel plugins for maps, pie charts and gauges.

    Ryan McKinley, vice president of applications for Grafana Labs, said Grafana has gained traction in DevOps environments in part because it makes it easier to query and analyze multiple types of data without having to pull it all into a central repository. All queries are launched against data wherever it resides, he said, noting by chaining a set of simple point-and-click transformations, users will be able to join, filter, rename and calculate all in the same platform.

    That approach makes it easier for DevOps teams to set up observability platforms using any mix of tools and services without much help from internal IT operations teams. That approach is now also starting to gain traction outside of DevOps environments as business analysts look for easier ways to also analyze data from different classes of applications, McKinley added.

    While observability has always been considered a core tenet of DevOps, achieving it has been challenging for most organizations. Simply setting up all the underlying platforms required has proven too challenging for many IT teams. Grafana has emerged as a tool that enables DevOps teams to visualize relevant data within the context of a custom-built observability platform.

    It’s not clear to what degree Grafana might emerge as a de facto standard. However, during an economic downturn, it’s not uncommon for IT organizations to rely more on open source tools to reduce costs. Rather than having to lay off an analyst or developer, many organizations will first look to reduce their reliance on commercial software licenses. Many of those same organizations have been wrestling for years with a fragmented approach to analytics software that often can yield conflicting insights.

    McKinley said one of the benefits of Grafana is that it reduces the cost of developing different models that enable organizations to explore different potential scenarios. Too often organizations are wedded to specific models that might not reliably reflect a new business trend simply because the cost of creating a new model is too high or takes too much time.

    Whatever the analytics path forward, the one thing that is clear is that as IT continues to become more complex thanks in part to the rise of microservices, DevOps teams will no longer be able to function without some form of observability platform being readily accessible. The only real question now is how best to go about building and maintaining that observability platform.