


ControlTheory today at the KubeCon + CloudNativeCon North America 2026 conference added support for metrics and traces to a platform that analyzes telemetry data at the point where it is collected.
Company CEO Bob Quillin said version 2.0 of the Dstl8 platform is now able to analyze logs, traces and metrics in a way that reduces the total cost of observability. Support for traces enables the Dstl8 platform to detect application performance problems, slow endpoints, rising error rates, and new request paths, down to specific lines of code. Metrics make it possible to, for example, forecast when a disk will fill or when a CPU will hit its limit.
Based on OpenTelemetry software for collecting telemetry data that is being advanced under the auspices of the Cloud Native Computing Foundation (CNCF), the platform makes use of a small language model (SLM) deployed on the collector to identify which telemetry signal may warrant further investigation, said Quillin. Dstl8 surfaces the worst request paths on its own and points engineers straight to the source of an issue, he added.
That approach reduces the volume of data that would otherwise have to be moved and stored in a cloud platform before being analyzed, he added. In effect, the “telemetry tax” that DevOps teams now pay to troubleshoot IT environments is sharply reduced, said Quillin.
In fact, the cost of storing telemetry data in the cloud creates a paradox. As the cost of storing data rises, more organizations opt to not collect as much. The trouble is that gaps start to emerge in the telemetry data that might be needed to investigate an IT incident. The Dstl8 platform makes it possible to collect the signals that really matter by using artificial intelligence (AI) to reason over sentiment, patterns, anomalies, and severity, said Quillin.
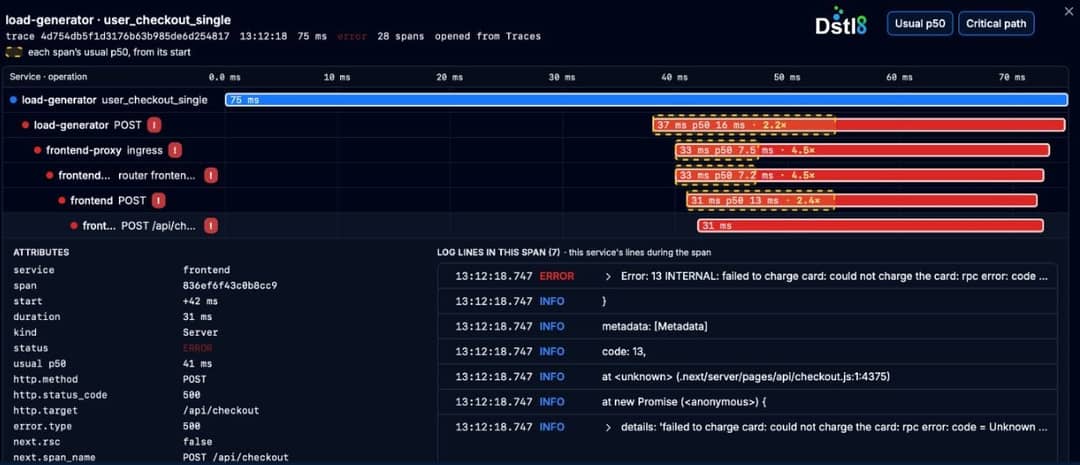
That capability is critical as more AI applications that generate massive amounts of telemetry data are deployed. Dstl8, for example, follows an AI request from the first step through every model call, including calls routed through gateways and on to the model server and the graphics processing units (GPUs) that drive the application. It also shows which step is slow or failing, with the model, provider, and token counts on every call. Plain-English readouts explain what each GPU and model server is doing and what might need to, as a result, be changed. Logs, metrics, traces, and sentiment are read together with Kubernetes events. Every incident is explained by what changed and when, with evidence from every signal providing the context that either a human engineer or AI agents acting on their behalf requires.
DevOps teams can also leverage AI to create dashboards on demand, or invoke an AI agent, dubbed Möbius, that ControlTheory provides to build them. Alternatively, DevOps teams using Prometheus or Jaeger tools can consume Dstl8 metrics and traces.
It’s not clear to what degree DevOps teams are already being overwhelmed by telemetry data but, arguably, the most important thing to remember is that it is not all of equal value.

Frequently Asked Questions
1. What is Dstl8?
2. Are metrics and traces generally available in Dstl8 2.0?
3. How does Dstl8 help troubleshoot AI workloads?

Mike Vizard is a veteran IT journalist with more than 25 years of experience covering the technology industry, having previously served as Editor-in-Chief of both CRN and InfoWorld and as editorial director for Ziff-Davis Enterprise, where he oversaw titles including eWEEK, CIO Insight and Baseline. Over his career he has also edited or contributed to a wide range of enterprise technology publications, including IT Business Edge, Channel Insider, ComputerWorld, TMCNet and Digital Review, and he later led editorial for CTOEdge.com. His reporting and analysis span software development, cloud computing, cybersecurity, IT channel strategy and, more recently, artificial intelligence and DevOps practices. A recognized voice in enterprise IT journalism, Vizard is known for tracking emerging technology trends as they move from early adoption into mainstream enterprise use. He now serves as Chief Content Officer for Techstrong Group, where he oversees editorial strategy across the full network — DevOps.com, Security Boulevard, Cloud Native Now, Digital CxO, Techstrong.ai, TechStrong.IT, Techstrong Semi and PlatformEngineering.com — in addition to writing and hosting content for Techstrong TV and the Techstrong Gang podcast.