

Sponsored Content
AI coding assistants now write a large share of front-end code, and much of it reaches production with minimal human review. Most guidance on observing AI-written code focuses on back-end traces and logs.
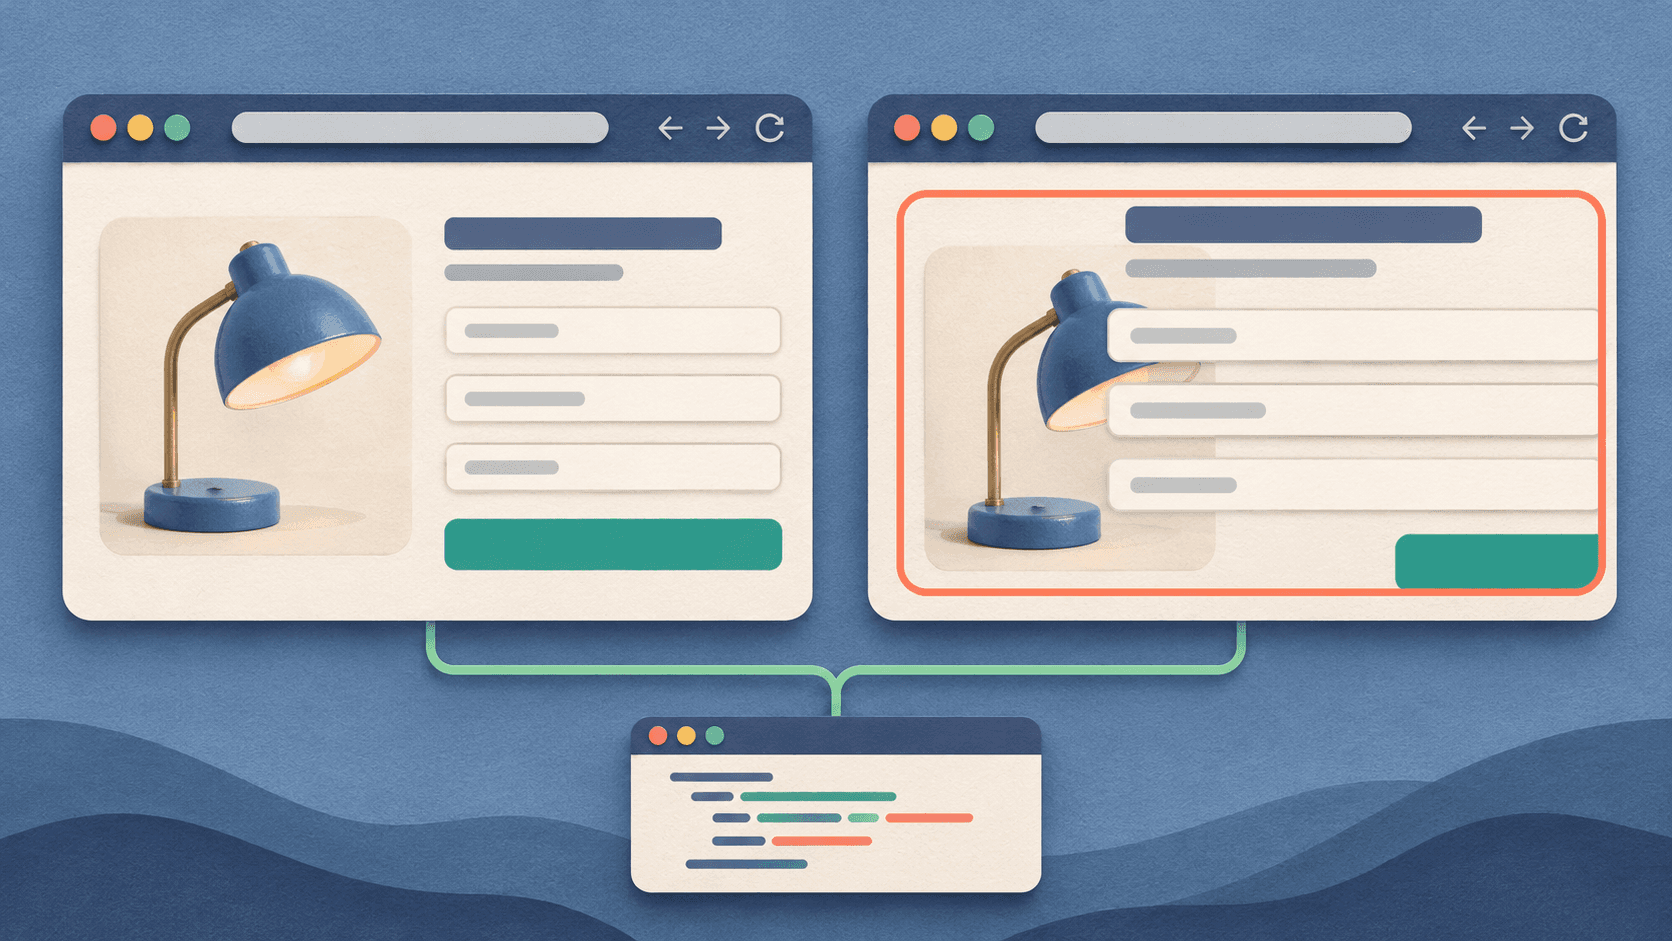
The front end receives less attention, and it is where failures surface first. An AI-written component can receive successful responses from every API it calls and still render a broken page in a specific browser, on a specific device, in a specific region. Back-end monitoring records nothing wrong, and the first signal is a user who cannot complete a task.
Why AI-Written Front-End Code Fails Differently
AI-written front-end code is typically validated in a narrow environment: the developer’s current browser and a headless Chromium instance in CI. Failures concentrate in whatever that environment does not cover.
- Framework edge cases. AI-written components can mishandle the handoff from server-rendered HTML to client-side JavaScript (hydration), run logic at the wrong time, or show stale data on screen. These failures tend to appear only under conditions that rarely occur in development, such as slow networks or interrupted navigation.
- Browser-specific errors. AI-written code can use newer JavaScript or CSS features without checking support in older Safari versions, Android WebView, or enterprise-managed browsers, producing errors or rendering failures that never appear in the developer’s browser.
- Layout shifts. Images, embeds, and dynamically inserted content added without reserved dimensions raise Cumulative Layout Shift (CLS) in ways that depend on viewport and load order.
- Heavier bundles. Added dependencies, duplicated utilities, and redundant polyfills increase payload size, which can delay Largest Contentful Paint (LCP) on slower devices and networks.
Third-party scripts add a further source of change, since tag managers, consent tools, and widgets can alter page behaviour without a deployment of first-party code.
None of these produce a failed HTTP request or a server error. Server-side monitoring reports healthy services while users in specific browsers, devices, and regions experience a broken page.
Tag Every Release and Compare Error Rates and Core Web Vitals by Browser
Every session and every error should carry the release identifier of the build that produced it. With that in place, the comparison that matters is release against release, segmented by browser, device, and region. Aggregate figures hide the pattern. A release can leave the overall JavaScript error rate unchanged while the rate rises sharply in one browser version that represents only a small share of traffic.
The comparison should cover JavaScript error rate, the share of sessions with no errors, and the 75th percentile of LCP, Interaction to Next Paint (INP), and CLS. Percentiles matter because Core Web Vitals are assessed at the 75th percentile, and regressions on slower devices appear there before they move an average. Comparing a canary cohort against the stable release shortens the time to a verdict, since both groups experience the same traffic conditions at the same time.
Use Source Maps and Session Replay to Reproduce Failures
Production bundles are minified, so a raw stack trace points to a compressed line in a bundle file. Uploading source maps with every build resolves traces to the original file and line. This matters more with AI-written code, because the developer may not have written it and may not know what it was meant to do. Runtime evidence has to substitute for knowledge of authorship.
Session replay supplies the missing context. Replaying the session in which an exception fired shows the clicks, navigation, and form input that preceded it, which turns “cannot reproduce” into a specific path. Linking each error to its replay avoids browsing recordings at random. Masking for sensitive fields should be configured before replay is enabled.
Gate Releases on Synthetic Journeys and Roll Back on Experience Regressions
Synthetic monitoring tests the journeys the business depends on, such as sign-up, search, and checkout, in real browsers on a schedule. Running them against a staging build before release, and from multiple browsers and locations afterward, catches failures that real traffic would otherwise find first.
Release gates should be defined in experience terms. A deployment that passes health checks on every service can still fail a journey. Rollback criteria can include a failed journey, an error rate above an agreed threshold in any major browser, or a Core Web Vitals regression beyond an agreed margin. Automating the rollback removes the delay of deciding under pressure.
Synthetic tests cover the journeys that were anticipated. Real user monitoring covers the long tail of browsers, devices, and paths that were not. Each covers what the other misses.
Build a Browser-Layer Safety Net for AI-Written Code
A baseline set of controls for the browser layer:
- A release identifier attached to every session and error
- Source maps uploaded with every build
- JavaScript error rate and Core Web Vitals compared per release, browser, device, and region
- Third-party scripts tracked separately from first-party code
- Session replay linked to errors, with masking for sensitive fields
- Synthetic journeys for sign-up, search, and checkout run before release and on a schedule afterward
- Rollback thresholds defined in experience metrics and automated
- Bundle size and resource load times tracked per release
Extend Production Monitoring to the Browser
AI-assisted development raises the volume and speed of front-end change while reducing the share of that change a developer has reviewed closely. The browser is the final deployment target and the one with the most variation. Observability that stops at the server leaves that variation unmeasured.
Platforms such as Site24x7 combine real user monitoring, synthetic monitoring, and APM in a single console, so a browser-level failure can be traced to the back-end call behind it when the cause lies on the server side.


Kirubanandan is an experienced product marketing professional driving go-to-market strategies and product positioning for ManageEngine's APM platform. His expertise spans information technology, application performance monitoring, digital experience management, and digital transformation.