Organizations are increasingly using distributed tracing to monitor their complex, microservice-based architectures. Distributed tracing has become essential in microservice applications, cloud-native and distributed systems. Microservices and serverless applications can grow exponentially, which makes observing them at scale very challenging. The traditional logging method becomes expensive, and if there’s an issue, time-series data can reveal symptoms but not the root cause(s). With modern usage patterns of Kubernetes service mesh like Istio and Envoy, for example, there can be billions of microservices calls daily.
What is Distributed Tracing?
Traces describe the progress of a transaction or workflow through a system. Distributed tracing provides visibility into service dependencies and their interdependencies by providing end-to-end visibility. Visualizing transactions in their entirety allows you to compare non-normal traces with normal ones to determine differences in behavior, structure and timing. Through distributed tracing, you can identify bottlenecks in your system. As a traced request flows through a network, it can be tracked.
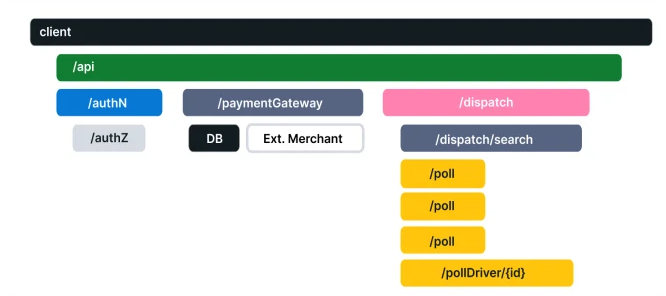
As requests flow from frontend to backend and to databases, traces provide diagnostic techniques that reveal how a set of services coordinate to handle an application request. Using distributed tracing, developers can troubleshoot requests with errors and high latency. A single trace typically shows the activity of a request or transaction within an application. A trace shows what has changed at each step. As you aggregate the traces, you can see which backend service or database has the most significant impact on performance.
The History of Distributed Tracing
Dapper, a large-scale distributed systems tracing infrastructure, was introduced by Google in 2010. Two years after Dapper was made public, Twitter open sourced Zipkin, which was designed for application performance tuning. Zipkin was the first open source distributed tracing project. Zipkin trace data can be collected and visualized using a UI. In 2015, Uber launched Jaeger, which was inspired by Dapper and named after the German word for hunter. Later in 2017, Uber published a blog post, called Evolving Distributed Tracing at Uber Engineering, explaining the reasons for the architectural choices in Jaeger. In addition to creating Jaeger, its author, Yuri Shkuro, wrote a book about distributed tracing called Mastering Distributed Tracing.
In 2016 Ben Sigelman, founder of Lightstep, wrote a blog post called Toward Turnkey Distributed Tracing, describing OpenTracing as a single standard. Some people refer to this as the OpenTracing Manifesto. OpenTracing allows developers of application code, open source packages and open source services to instrument their code without binding themselves to any particular tracing solution. The goal of OpenTracing was to solve a standardization problem. Trace context must pass through all the components, including application code, dependent libraries, standalone open source services (Nginx, MySQL) and other vendor-specific libraries and services, to collect a complete distributed trace. Collecting a full path without a standard API to define the collection and passing of trace context is difficult. OpenTracing aims to solve this problem by defining a standard API that can be implemented by components from different tracing solutions, allowing the collection of end-to-end tracing data. The Cloud Native Computing Foundation (CNCF) accepted OpenTracing as its third project in October 2016. Two months later, OpenTracing 1.0 was released. After OpenTracing, Jaeger joined the CNCF.
W3C tracing context specification was proposed in November 2019, bringing distributed tracing closer to standardization. Over ten years, distributed tracing evolved from one paper to an active community. With standardization on all the layers, it is moving from just tracing to overall observability, ranging from latency optimization to root cause analysis and application performance management. It is moving from a single backend system to an end-to-end solution that spans multiple systems.
OpenTracing and OpenTelemetry merged in 2019. Using OpenTelemetry, distributed tracing can be implemented end-to-end. It released version 1.0 in 2021. CNCF’s OpenTelemetry project is one of the fast-growing projects, and OpenTelemetry has become the de facto standard for tracing, metrics and logging.
How it Works
Traces in distributed tracing consist of tagged time intervals called spans. It is possible to think of a span as a unit of work. Traces are directed acyclic graphs (DAGs) composed of segments known as spans. According to OpenTelemetry, There are four major components of a trace:
- traceID
- A unique 16-byte array to identify the trace that a span is associated with
- spanID
- Hex-encoded 8-byte array to identify the current span
- Trace Flags
- Provides more details about the trace, such as if it is sampled
- Trace State
- Provides more vendor-specific information for tracing across multiple distributed systems. Please refer to W3C Trace Context for further explanation.
The spans in a trace consist of contiguous segments of work that are named and timed. There are start and end times for spans, as well as metadata such as tags or logs that help classify them. Parent-child relationships may be present between spans to show how particular transactions traverse the application’s numerous services and components.
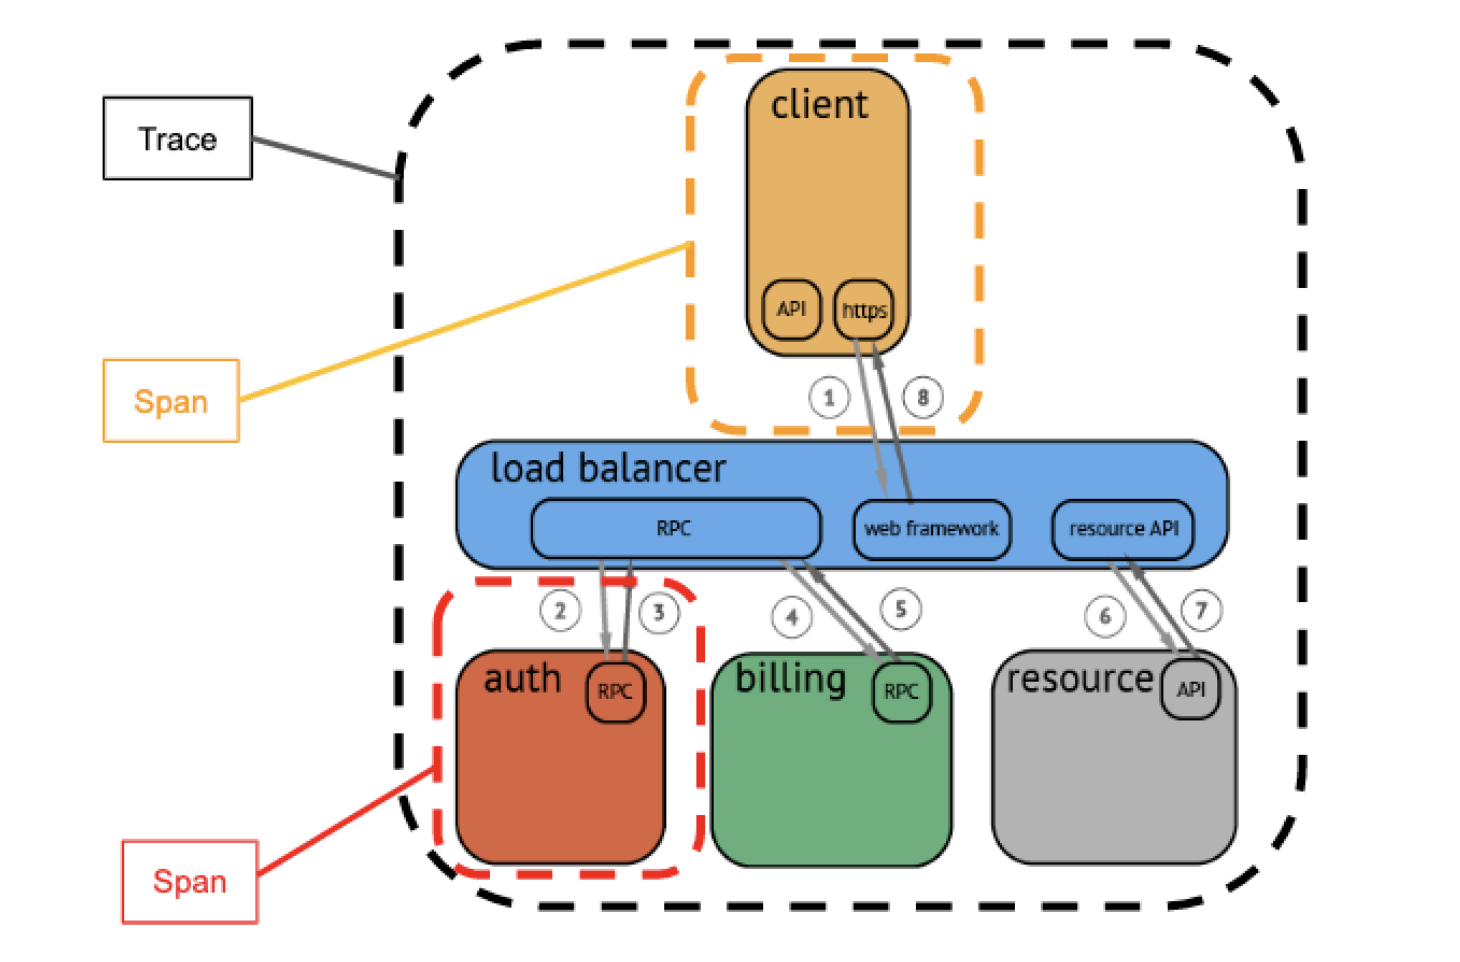
A trace represents an end-to-end request; it can contain one or more spans. Spans indicate work performed by a single service with associated time intervals and metadata. The purpose of traces is to provide a request-centric view of spans through tags. Despite microservices enabling teams to work independently, distributed tracing offers a central resource that allows all teams to understand issues from a user’s perspective.
Conclusion
In distributed systems, response latency can have a significant commercial impact. Identifying bottlenecks and understanding how a request moves through a complex system is complicated. Other techniques, like logging and monitoring metrics, don’t provide insight into distributed applications such as those created with microservices architecture. Several open standards and tools are emerging within the distributed tracing space, like OpenTracing and commercial tools that could compete with existing APM solutions. Implementing distributed tracing for modern cloud-native services poses several challenges. OpenTelemetry tracing is necessary for processing high volumes of trace data while generating meaningful insight.
