The Application model can be incredibly useful to map out application features, planned changes and current flaws, and even for roadmapping. The model takes organizational time and effort, and can only be created and maintained when a universal language has been developed by a modeling team. The effort is well worth the cost, however, since it can lay the foundation for a better DevOps environment.
The modeling team will represent various organizational backgrounds and must bridge gaps of understanding that are common between technical and non-technical personnel. The team also will include operations and development professionals so that collaborations produce not just deeper understandings, but also lay framework that meets, corporate, Dev and Ops needs from the beginning.
Diagrams can be used by the modeling team to foster the understanding and creation of a universal language by adding more context to ideas and processes. Diagrams serve as a drill-down exercise and can be drawn on a whiteboard, sketched on a notepad or formalized with a UML tool.
Diagrams become more technically correct as they are iterated on, and can be easily retained for future discussions. Further, the base of some diagrams often enable other types of diagrams that can be helpful to the development team (such as Class or ERD) and provide a level of technical documentation. They also provide a base of discussion for the modeling team to relay discussions back to their organizational units for feedback and improvement.
Last, and perhaps most importantly, diagrams help to remove ambiguity that is inherent to narrative descriptions and discussions. Removing ambiguity is at the heart of the universal language and enables clear communication, a key tenant of DevOps.
We can show this drill-down in diagramming by focusing on a small and simple operation: describing what happens when a new customer enters a banking system for a business loan.
UseCase Diagram
A common place to start is a UseCase Diagram like the one below.
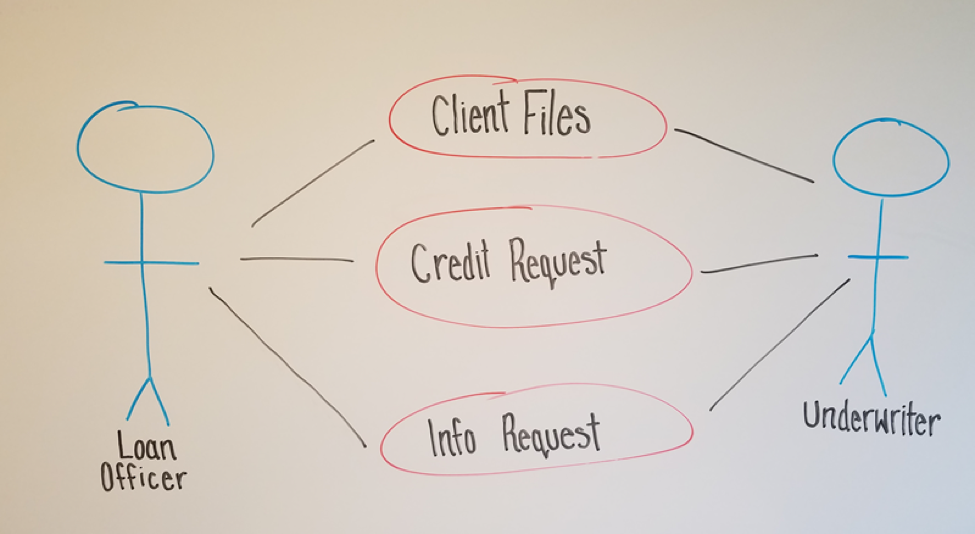 The diagram shows a few key points of data:
- There are two types of employees (actors) that are involved: a Loan Officer and an Underwriter
- The Loan Officer and the Underwriter interact with three business elements: Client Files, Credit Requests, Requested Information
This diagram might not seem very useful to those outside of the discussion, but it is the first step to creating more in-depth and useful diagrams.
Activity Diagram
A logical and easy step from a UseCase Diagram is an Activity Diagram. It takes many of the same concepts and expands them to a step-by-step order of procedures, which are established by discussion of current procedures as well as compliance and regulatory needs.
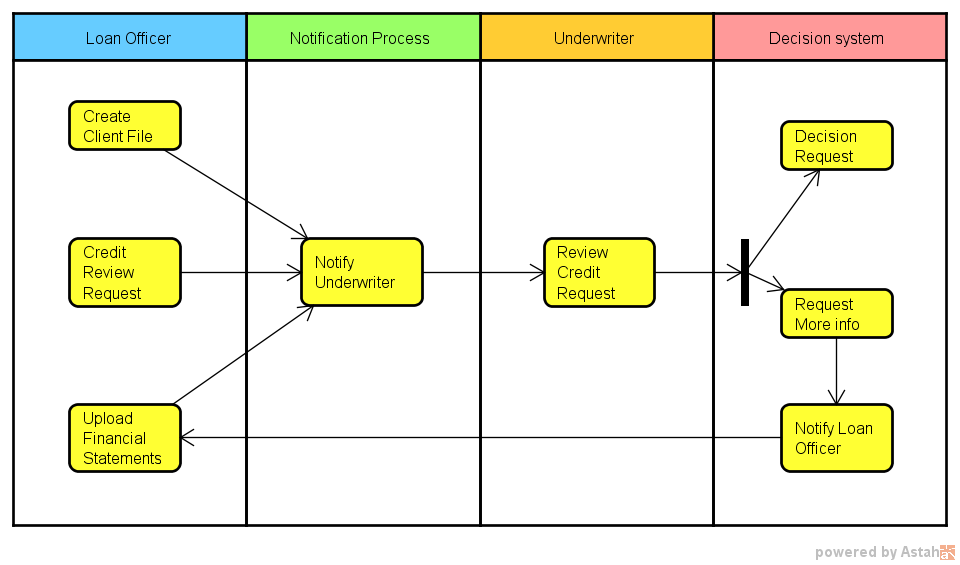 By partitioning procedures into vertical “swim lanes” we now have an order to the processes as well as who or what is responsible for it.
The first partition, labeled Loan Officer, shows three processes (Create a Client File, Create a Credit Request, and Upload Financial Statements) that they are responsible for before the system can do anything. All three pieces must be present before moving beyond this first position.
Once those items are taken care of, the system then notifies the second Actor, the Underwriter, that there is a credit review for him or her to perform as well as where to locate the needed data.
The Underwriter then decides whether the loan is approved. Whether this is a semi-automated process or done entirely by humans is beyond the scope of this diagram; all we need to know is that a decision happens next. What we can see is that the Underwriter has two options. He or she can:
- Decide on the loan (approve or deny—again, beyond the scope), at which case the system takes over from there.
- Request more information from the Loan Officer (perhaps the wrong files were uploaded or more data from the client is needed). The system would then notify the Loan Officer and the process starts over.
Activity Diagrams are useful for documentation because they start to add structure to the overall business process. They also start to define which processes are:
- Managed by humans
- Managed by the application being developed
- Represent a system that the application will interact with, and operations will need to secure
Even if not 100 percent technically correct (as our sample isn’t entirely correct), they still represent information in a meaningful way that anyone with little or no guidance can understand.
Data Flow Diagram
With Data Flow Diagrams (DFD) the diagrams start to map out the system and procedures that happen and the flow of data. DFDs, which are more involved than the other diagrams so far, become keenly useful in showing how different processes interact. Even though DFDs become more detailed as more layers are added, they are still understandable and explainable to any member of the modeling team no matter the background.
Operations teams often find them helpful since they map out when sensitive data may be accessed or stored. In our example, things such as corporate tax returns will be stored and accessed; there obviously would need to be some security measures implemented to ensure only those with clearance can see them.
Discussions are key when creating Data Flow Diagrams because it would be very rare for an individual to have all of the knowledge needed to create one without questions and answers. Based on our current diagrams and a few questions such as:
- Are Client IDs manually created, or is it part of a system?
- Do requests go to specific people or are they delivered via queue?
- Is the credit decision part of the original application or saved as a separate file?
A DFD can be drawn up:
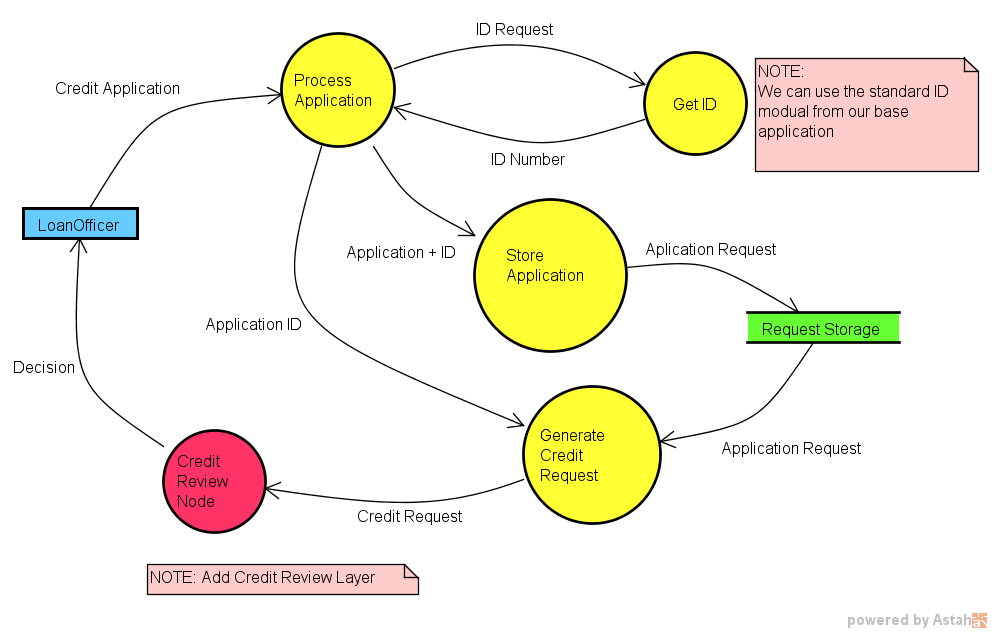 The DFD may look complex at first, but when taken piece by piece it is quite simple and understandable with very little (if any) explanation. It also can be helpful to the Dev team because it isolates specific processes at a granular level.
For example, the Dev team may see the process “Get ID,” know that it’s a system process (non-manual) and realize that they already have a module like that in an existing application that they can use for this application.
Of course, this would be one of many DFDs created during an Application Model, which is another key advantage of using DFDs. Data Flow Diagrams can be layered, starting with a context diagram and working down granularly to the smallest process needed. This layering also naturally helps to break down the application to discreet parts, helping both in creating different parts of the Application Model as well as having natural starting and stopping points for conversations.
With the idea that there can be many diagrams used during these discussions, it can be useful to use a modeling tool to easily create, edit, layer and store the diagrams for future use.
Other Diagrams
Of course, these are only a few diagrams, but they demonstrate how a process of diagramming can be useful to help a modeling team communicate. While a team could start with a Data Flow Diagram, it would be a much more difficult process. However, by walking through a UseCase and an Activity, it becomes easier since it breaks a system down into digestible parts.
It also provides the modeling team easy-to-understand diagrams when they go back to their business units. They can explain the Application Model and get quality feedback, as well as suggestions to be added into the Model.
These diagrams also can be helpful for teams as a starting point for documentation. The DFD is a good starting point for:
- The Development team to create a detailed class and component diagrams that outlines the application architecture.
- A deployment diagram for Operations to note which data to isolate behind a firewall with limited access.
While no process of diagramming can create a universal language by itself, diagrams are supremely helpful to create team clarity. They also serve as a memory of Application Model discussion so that human error and memory can be reduced. Last, by helping to eliminate ambiguity among the modeling team, they help drive better communication that is part of the essence of DevOps.
Note diagrams were created in Astah Professional and used with permission. To learn more about Astah and modeling please visit the company’s website.
About the Author / Scott Reece
 Scott Reece is a huge fan of the greater visibility and communication enabled by DevOps. As a Friend of Astah Scott has been successfully closing project communication gaps by using models and team building. With more than 10 years of project management experience, Scott currently serves as a Partner Director at Inedo.
