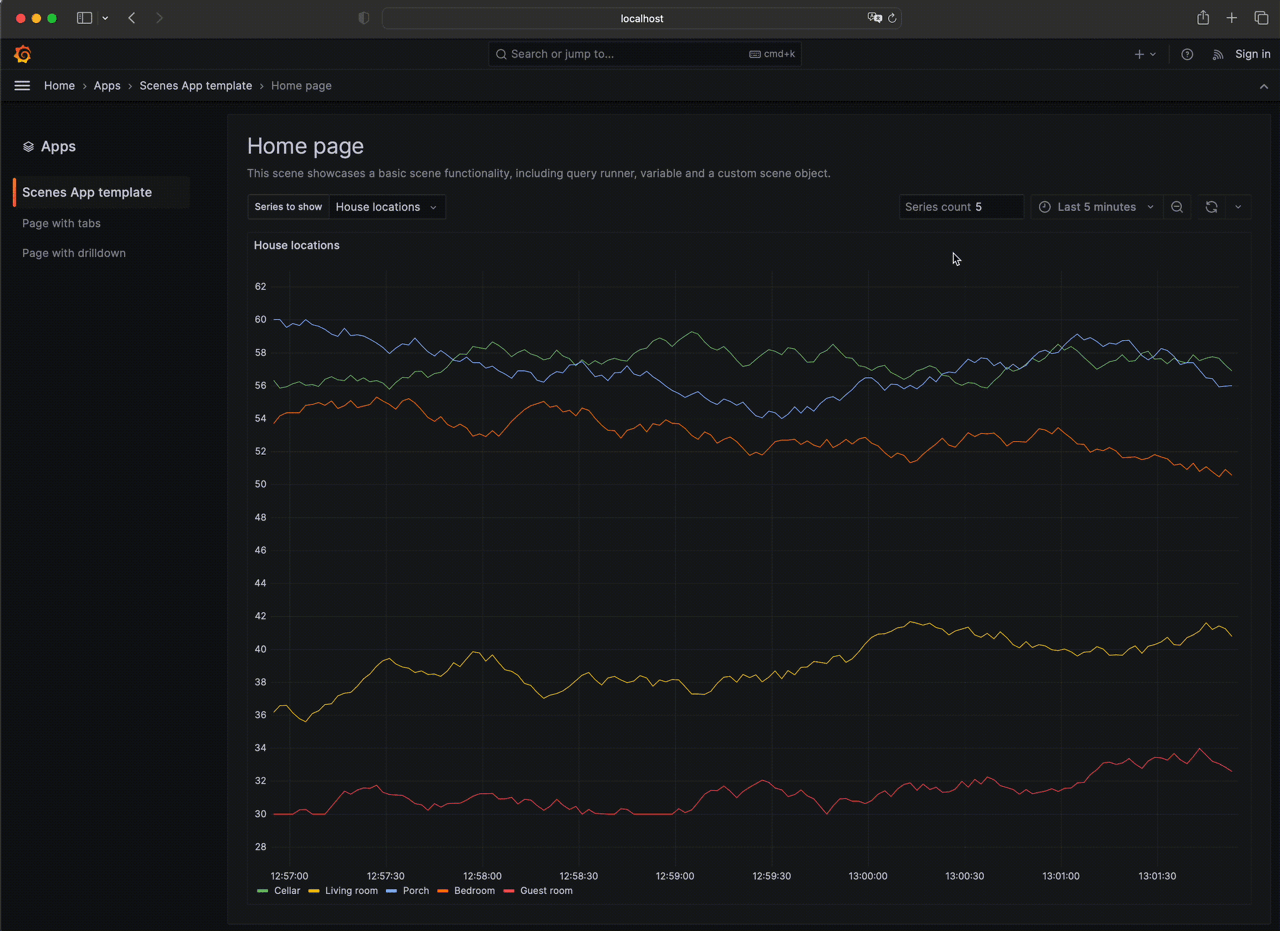
At its GrafanaCON 2023 event today, Grafana Labs updated its core platform for visualizing data which makes it simpler to set up dashboards in minutes. The updates are part of a celebration of the 10th anniversary of a tool that is now widely used by DevOps teams.
Ryan McKinley, a distinguished engineer for Grafana Labs, said Grafana 10 should help make DevOps more accessible to a wider range of practitioners with limited experience working with observability tools. The latest release also makes it simpler to share knowledge with external stakeholders via public dashboards, he added.
In addition, Grafana 10 adds expanded role-based access control (RBAC) capabilities and streamlined implementation of the secure access markup language (SAML) to ensure authentication.
Grafana Cloud has also been updated to provide a secure way to connect to data residing in an on-premises IT environment or in a cloud with the observability platform the company provides via a software-as-a-service (SaaS) platform.
Finally, Grafana Labs is also making the engine it created to visualize data more accessible to third-party developers that are embedding visualizations based on Grafana within their applications, noted McKinley.

There are now more than 150 plugins for various data sources that have been made available to more than 20 million users of the Grafana visualization framework. Not all those users are working in DevOps environments, but Grafana is widely used to enable observability across increasingly complex IT environments. The Grafana Cloud seeks to capitalize on that popularity by adding a service that uses an instance of open source Grafana Mimir software to store data collected in a format originally defined for the open source Prometheus monitoring tool.
It’s still early days as far as adoption of observability is concerned, but it’s apparent that as application environments become more complex, the plethora of monitoring tools that DevOps teams rely on will need to be streamlined. Observability platforms promise to unify logs, metrics and traces to simplify launching queries to identify the root cause of an issue.
The rate at which DevOps teams will embrace observability will naturally vary, but the biggest obstacle might not be the platforms themselves. Instead, the issue is understanding what queries can help DevOps teams better understand the root cause of an IT issue before there is a major disruption. In the long term, it’s expected that machine learning algorithms will leverage the data collected by observability platforms to automatically identify issues that might lead to a disruption long before it actually occurs.
Of course, the result of any query that gets launched needs to be visualized in a way that is easily understood. Grafana Labs is now making a case for a more integrated approach that, at its core, employs its visualization tools to make it simpler to discern what’s occurring in IT environments. After all, no matter how talented any DevOps team may be, it’s still not possible to manage what was never seen in the first place.


