

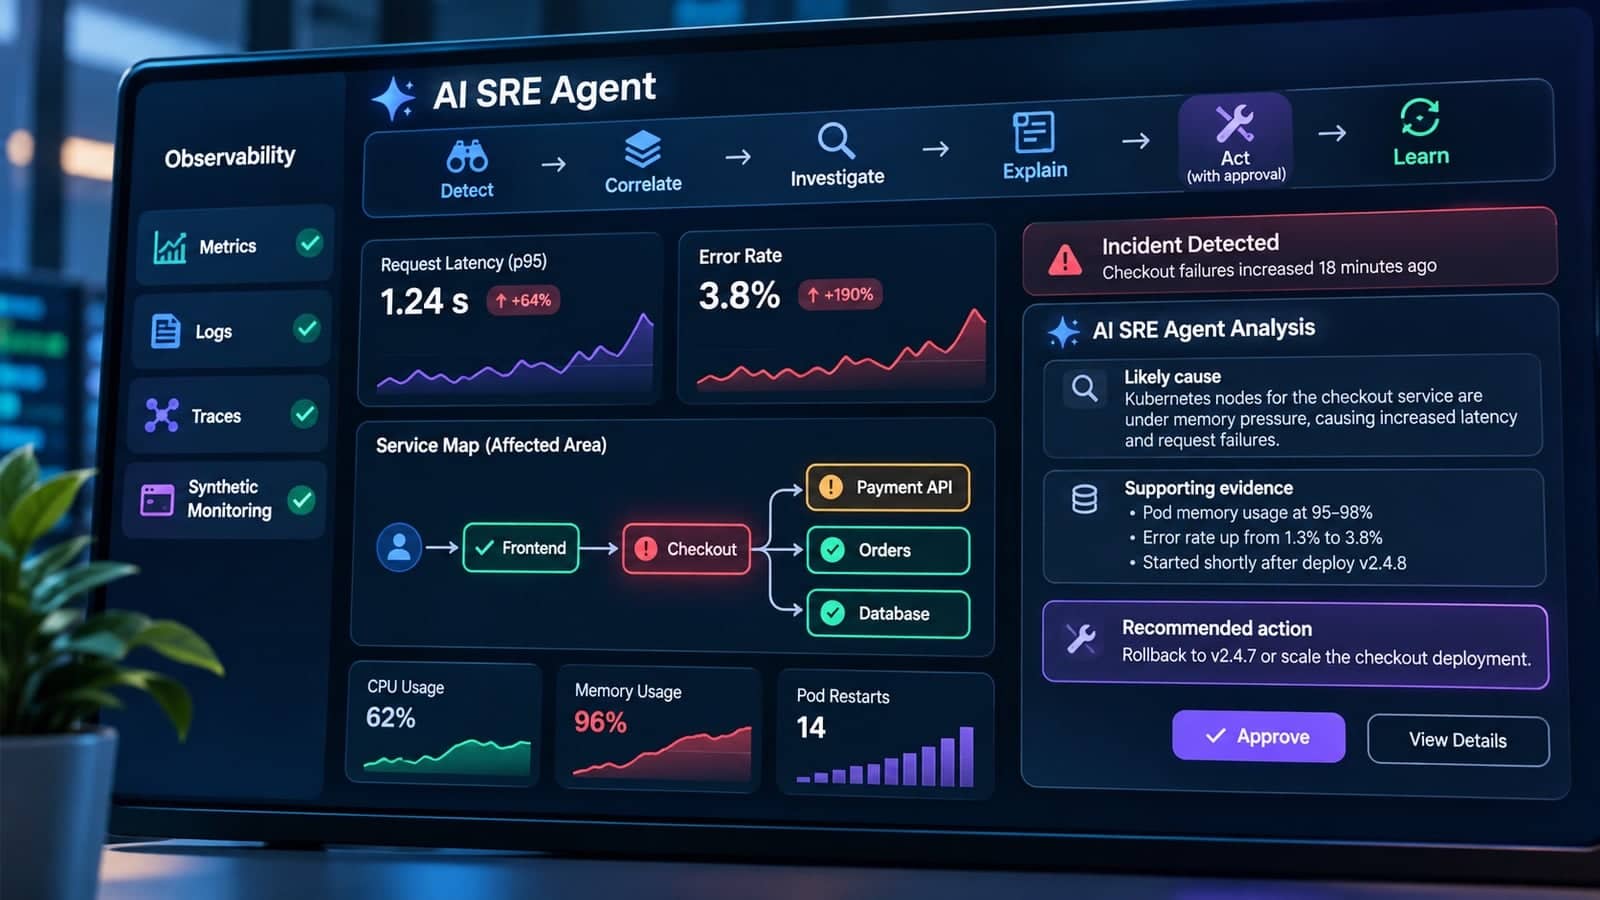
Modern systems fail in ways that dashboards were never designed to explain. A single checkout failure can trace back to a Kubernetes node under memory pressure, a slow third-party API, or a log line nobody was watching. Teams now run hundreds of services, thousands of containers and millions of telemetry events per minute. Humans can no longer read all of it.
This is the gap that AI SRE agents are starting to fill. This article explains what they are, how they connect to observability, log monitoring and synthetic monitoring, and where they still fall short.
What Is an AI SRE Agent?
An AI SRE agent is software that uses machine learning and large language models to help with the work site reliability engineers do during and after incidents. It does not replace the engineer. It takes over the slow, repetitive parts of investigation.
Typical tasks include:
- Reading alerts and grouping related ones into a single incident
- Pulling metrics, logs and traces for the affected service
- Comparing current behavior with recent deployments or config changes
- Proposing a likely root cause with supporting evidence
- Suggesting or drafting a remediation, such as a rollback or a scaling change
One difference from traditional AIOps tools is the emphasis on reasoning across multiple sources of evidence. Rather than simply flagging anomalies, an agent can follow a chain of evidence, much like an engineer asking one question after another.
Why Traditional Monitoring Struggles at Scale
Classic monitoring works on thresholds. CPU above 90 percent, error rate above 2 percent, disk above 85 percent. That approach still has value, but it breaks down in three ways.
Alert fatigue. Dynamic infrastructure produces constant noise. Autoscaling, short-lived pods and rolling deploys trigger alerts that mean nothing. Engineers learn to ignore pages, and the real incident gets lost.
Missing context. An alert tells you something is wrong, not why. The engineer still has to open five tools, match timestamps and guess.
Slow investigation. A significant portion of incident resolution time can be spent on diagnosis rather than the fix itself. Finding the cause is often the bottleneck.
AI agents target exactly these three problems: noise, context and diagnosis time.
The Foundation: Good Observability Data
An AI agent is only as good as the data it can see. This is the part vendors rarely stress. If your telemetry is incomplete or inconsistent, the agent will produce confident but wrong answers.
Observability is usually described through three signal types:
- Metrics show trends and saturation, such as latency, error rates and resource usage.
- Logs record what actually happened inside a service at a specific moment.
- Traces follow a single request across services and show where time was spent.
The Google SRE book popularized the idea of monitoring the “golden signals” of latency, traffic, errors and saturation. These remain a practical starting point, and they give an AI agent a clear structure to reason about.
A few habits make telemetry far more useful to any automated system:
- Use consistent service, environment and team labels across every tool
- Keep log formats structured, preferably JSON, with a request or trace ID
- Record deployment events so changes can be correlated with incidents
- Control metric cardinality so that storage and query costs stay predictable
Without shared identifiers, an agent may struggle to reliably connect a failing user journey to the pods that serve it.
Log Monitoring: Where Agents Add the Most Value
Logs are the richest source of root cause detail and also the hardest to read. A busy cluster can generate gigabytes per hour, and during an outage the useful lines are buried.
AI agents help in several practical ways:
- Pattern clustering. Millions of lines collapse into a few dozen distinct message patterns, so a new error type stands out immediately.
- Anomaly detection. A sudden rise in a rare error is surfaced even if no alert rule exists for it.
- Natural language search. Engineers can ask “what changed in the payment service in the last 30 minutes” instead of writing complex query syntax.
- Summarization. Long stack traces and repeated errors are condensed into a readable explanation.
This saves real time, but it needs guardrails. Logs often contain personal data, tokens or secrets. Teams should mask sensitive fields before logs reach any AI system and confirm where the data is processed and stored.
Synthetic Monitoring: The User’s Point of View
Internal metrics can all look healthy while customers cannot log in. Synthetic monitoring closes that gap by running scripted tests against your application from outside, the same way a real user would.
Common uses include:
- Browser tests for login, search, checkout and other multi-step journeys
- API checks that validate status codes, response times and payloads
- Tests from multiple regions to catch routing, DNS or CDN problems
- SSL certificate and uptime checks
For AI SRE agents, synthetic results are a valuable early signal. A failed checkout test is a symptom with a clear business meaning. The agent can then look inward, checking recent deploys, database latency and pod health to explain it.
One practical tip: treat authentication flows carefully. Multi-factor steps are a common cause of flaky tests. Use test-only accounts, generate time-based codes inside the script, and run full login tests less often than lighter pre-authenticated checks.
How the Pieces Work Together
The strongest setups combine all three layers in one workflow:
- Detect. A synthetic test fails or an error rate crosses a threshold.
- Correlate. The agent groups related alerts and links them to the affected service.
- Investigate. It queries logs, metrics and traces for that service and compares them to the last deploy.
- Explain. It produces a short summary with the likely cause and the evidence behind it.
- Act. It proposes a fix, and a human approves it.
- Learn. The incident is written up, and the findings improve future alert rules and runbooks.
Notice that a person stays in the loop at the action step. That is deliberate.
Limits and Risks to Understand
AI SRE agents are useful, but they are not magic. Teams should go in with realistic expectations.
Hallucinated causes. Language models can produce plausible explanations that are simply wrong. Every conclusion should link to the underlying data so an engineer can verify it quickly.
Data quality dependence. Gaps in telemetry lead to gaps in reasoning. An agent cannot analyze a service that emits no useful logs.
Security and privacy. Giving an agent access to production data and infrastructure needs strict permissions. Start with read-only access.
Over-automation. Letting an agent restart services or change configuration on its own is risky. Begin with recommendations, then automate only low-risk, well-understood actions.
Cost. Sending large volumes of telemetry to AI services can be expensive. Sample intelligently and filter before analysis.
How to Get Started Without Overcommitting
You do not need a full platform change to benefit from this trend. A sensible path looks like this:
- Clean up your telemetry first. Standardize labels, structure your logs and remove noisy, low-value metrics.
- Pick one painful use case. Alert grouping or log summarization during incidents is usually a good first target.
- Keep humans in control. Use read-only access and require approval for any change.
- Measure the result. Track mean time to detect, mean time to resolve and the number of pages per engineer before and after.
- Review regularly. Check where the agent was wrong and feed that back into runbooks and alert rules.
The Road Ahead
Observability is moving from “show me the data” to “tell me what is wrong and what to do about it.” AI SRE agents are an early but real step in that direction. They will not remove the need for skilled engineers or good instrumentation. What they can do is shorten the path from alert to understanding, so people spend their time on fixes and design improvements instead of searching through dashboards at 3 in the morning.
Teams that invest in clean telemetry, clear ownership and cautious automation today will be best placed to benefit as these tools mature.
Author bio: Ashwini Dave is a product marketer at Middleware, where she turns complex DevOps and observability stories into SEO-led growth. With an MBA in Marketing and a deep love for AI and modern tooling, she builds campaigns that actually move the pipeline, not just pageviews. When she’s not geeking out over content and metrics, you’ll find her chasing sunsets and new trails around the world.
Gravatar Mail ID (editorial use only): [email protected]


Ashwini Dave is an accomplished digital marketer specializing in SEO and groundbreaking campaigns. With an MBA in Marketing, she crafts strategic, high-impact results. A tech enthusiast exploring AI and cutting-edge tech, Ashwini seamlessly integrates innovation into her marketing strategies. Outside the digital sphere, she is an avid traveler, finding inspiration in nature's beauty as she explores the world.