Recently on DevOps.com, Anais Baig provided a brief overview of the privacy process and capabilities that developers need to think about to comply with new global privacy laws such as Europe’s GDPR and California’s CCPA. Top of the list for complying with these laws? The need to build a business data map.
It’s no exaggeration to say that without a comprehensive, accurate data map—or, in other words, a complete inventory of the personal data the business possesses at any given time—it’s impossible to comply with these modern privacy regulations. Developers will understand better than most the difficulty in creating and then maintaining this record.
But it can be done, and today we’re going to dive into the requirements and some of the technical processes that go into crafting a data map.
What’s in a Data Map?
In simple terms, a data map shows the personally identifiable information (PII) your business possesses, why you possess it, where it lives and how it’s being used. To answer these four questions, you’ll need to audit the databases in your business. Be sure to include those that are part of third-party SaaS applications as well as your own proprietary data systems; figure out the fields of information contained in each. Then you’ll need to coordinate with your team to understand the business purpose for which each of those data points is being used.
The bulk of the work that developers typically do is that first step: auditing the business data system and documenting the database structures. At the very least, these are the things that you’ll need to be able to say about every field of personal information you possess:
Source: How was it collected?
Use Case: What is the business purpose for which it is being used?
Storage: Where is it being stored for additional processing, transformation or record-keeping?
Access: What business units have access to the data?
Retention: What is the schedule for deleting this data or renewing the user’s consent to possess it?
Consent: Was this data obtained through explicit customer consent?
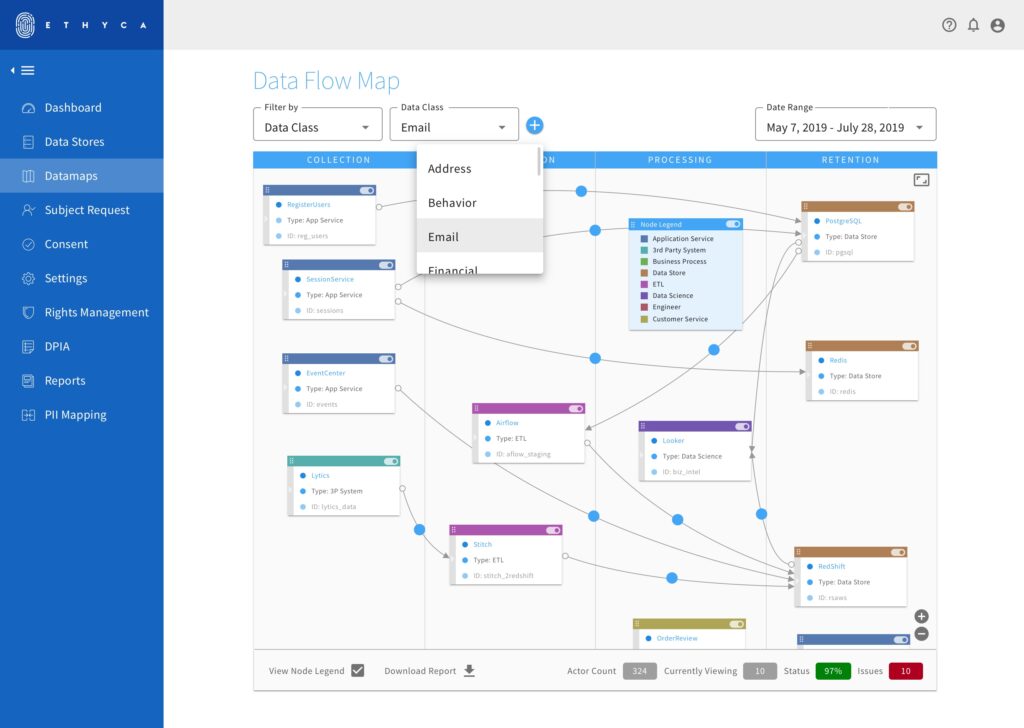
If you’re a small business, sometimes a data map can be “visualized” with a simple spreadsheet, but it very quickly uses its utility as data infrastructure scales. Larger businesses often find it very useful to construct a data map like an actual map, with a visual representation of the data relationships that exist in the business. In this form, a data map most often contains nodes and links to show how different systems that contain any personally identifiable information link together in your organization.
Here’s one built by Ethyca:
As you can imagine, without automated tools it takes a good bit of grunt work to get to this point of elegant visualization. For those just getting started mapping data in their business, we recommend a hybrid mapping approach.
The Hybrid Approach to Mapping
The hybrid approach means using an automated baseline process to identify and record the individual personally identifiable information that your organization is processing into one central repository, and then using manual label analysis data analysis to annotate and verify entity relationships across applications in your stack.
Label analysis involves using a data attribute’s name to decide which data dictionary element the attribute identifies. For example, an attribute named ‘email_id’ can be identified as ‘person.contact.email-address’.
When the attribute’s name alone is not enough, the name of the entity to which the attribute belongs is included in the analysis. For example, the attribute named ‘name’ in an entity named ‘customer’ can be identified as a name of a person, whereas a similarly named attribute in an entity named ‘city_master’ can be identified as a name of a city.
Sometimes a group of attributes occurring together can be identified easily. For example, attributes with names ‘lat’ and ‘lng’ can be identified as latitude and longitude of a location. Similarly, attributes with names ‘f_name’ and ‘l_name’ can be identified as parts of a person’s name.
Data analysis lets you manually confirm the relationships posited in your label analysis by using actual data from your databases to test.
The presence of certain values or patterns in the actual data can confirm certain mappings. For example, if the data for an attribute follows ‘[email protected]’ pattern, it can be confirmed that this attribute captures an email address.
Range values captured in attributes of different tables can be checked to see if those attributes are referring to the same piece of information, such as a user_id, that can be used for linking the tables with specific relationships. Similarly, the absence of values in an attribute can confirm the opposite.
If you’re not using an off-the-shelf data mapping solution, the label and data analysis processes can be arduous. But if done correctly, by the time you’ve completed the exercise, you’ll have a comprehensive understanding of how the data in your business links together, and you’ll be ready to start answering the compliance-related questions about each PII field you hold. You can also begin thinking about processes for maintaining the map’s accuracy as your data inventory flexes and evolves.
