Logz.io announced today the general availability of a cloud service, based on Prometheus, that can collect and analyze metrics alongside its existing log management service.
Jonah Kowall, CTO, Logz.io, said the goal for Prometheus-as-a-Service is to provide IT teams with a centralized approach to analyzing data collected from instances of Prometheus running on local servers and clusters. While Prometheus is relatively easy to deploy, it’s not designed to scale horizontally, which means IT teams have to deploy multiple instances of Prometheus on a fleet of clusters and servers. The Logz.io service makes it easier to aggregate and analyze all the data those instances of Prometheus collected, said Kowall. That approach not only offloads the storage of those metrics, Kowall said, it presents an opportunity to correlate that data against logs and traces that Logz.io already collects.
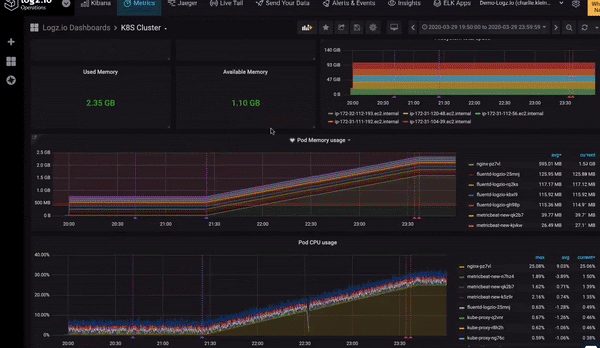
Logz.io, as part of that effort, is also making it possible to upload a Grafana dashboard, typically employed to visualize Prometheus data as a JSON file, to Logz.io, which will then convert the Grafana dashboards to dashboards based on the Logz.io user interface.
While Prometheus is closely identified with Kubernetes, IT teams are starting to deploy the open source monitoring tool more widely to collect metrics. A recent Gartner report predicts that, by 2025, half of new cloud-native application monitoring deployments will rely on some form of open-source software to instrument applications. As part of that transition, Prometheus has already emerged as a de facto standard, Kowall noted.
The primary focus, at least initially, is still on monitoring IT platforms, but as IT teams start to correlate metrics, logs and traces, they begin to benefit from additional context, otherwise known as observability, Kowall said.
Observability, of course, has always been a core DevOps principle. However, as more applications become instrumented using open source tools and agent software, it’s becoming less costly to achieve. DevOps teams will still need to instrument each application, but the costs associated with collecting metrics and other data continues to decline. Most providers of monitoring tools and observability platforms are moving toward adding support for open source tools and agents to collect data alongside the proprietary tools and agent software they already make available. It will be up to each DevOps teams to decide whether to rely on open source tools or continue to rely on proprietary software that may be able to surface deeper insights or is simply easier to deploy.
Regardless of the path chosen, the rise of microservices-based applications with numerous dependencies is forcing the observability issue. Microservices-based applications may not crash as frequently as a monolithic application because they are, ideally, designed to degrade gracefully in the absence of a single point of failure. The challenge is that, once they do degrade, it’s difficult to pinpoint the source of the issue; this may result in applications running sub-optimally for an extend period of time.
The good news is that DevOps teams should now have the tools required to diagnose and resolve those issues long before any end user notices.
