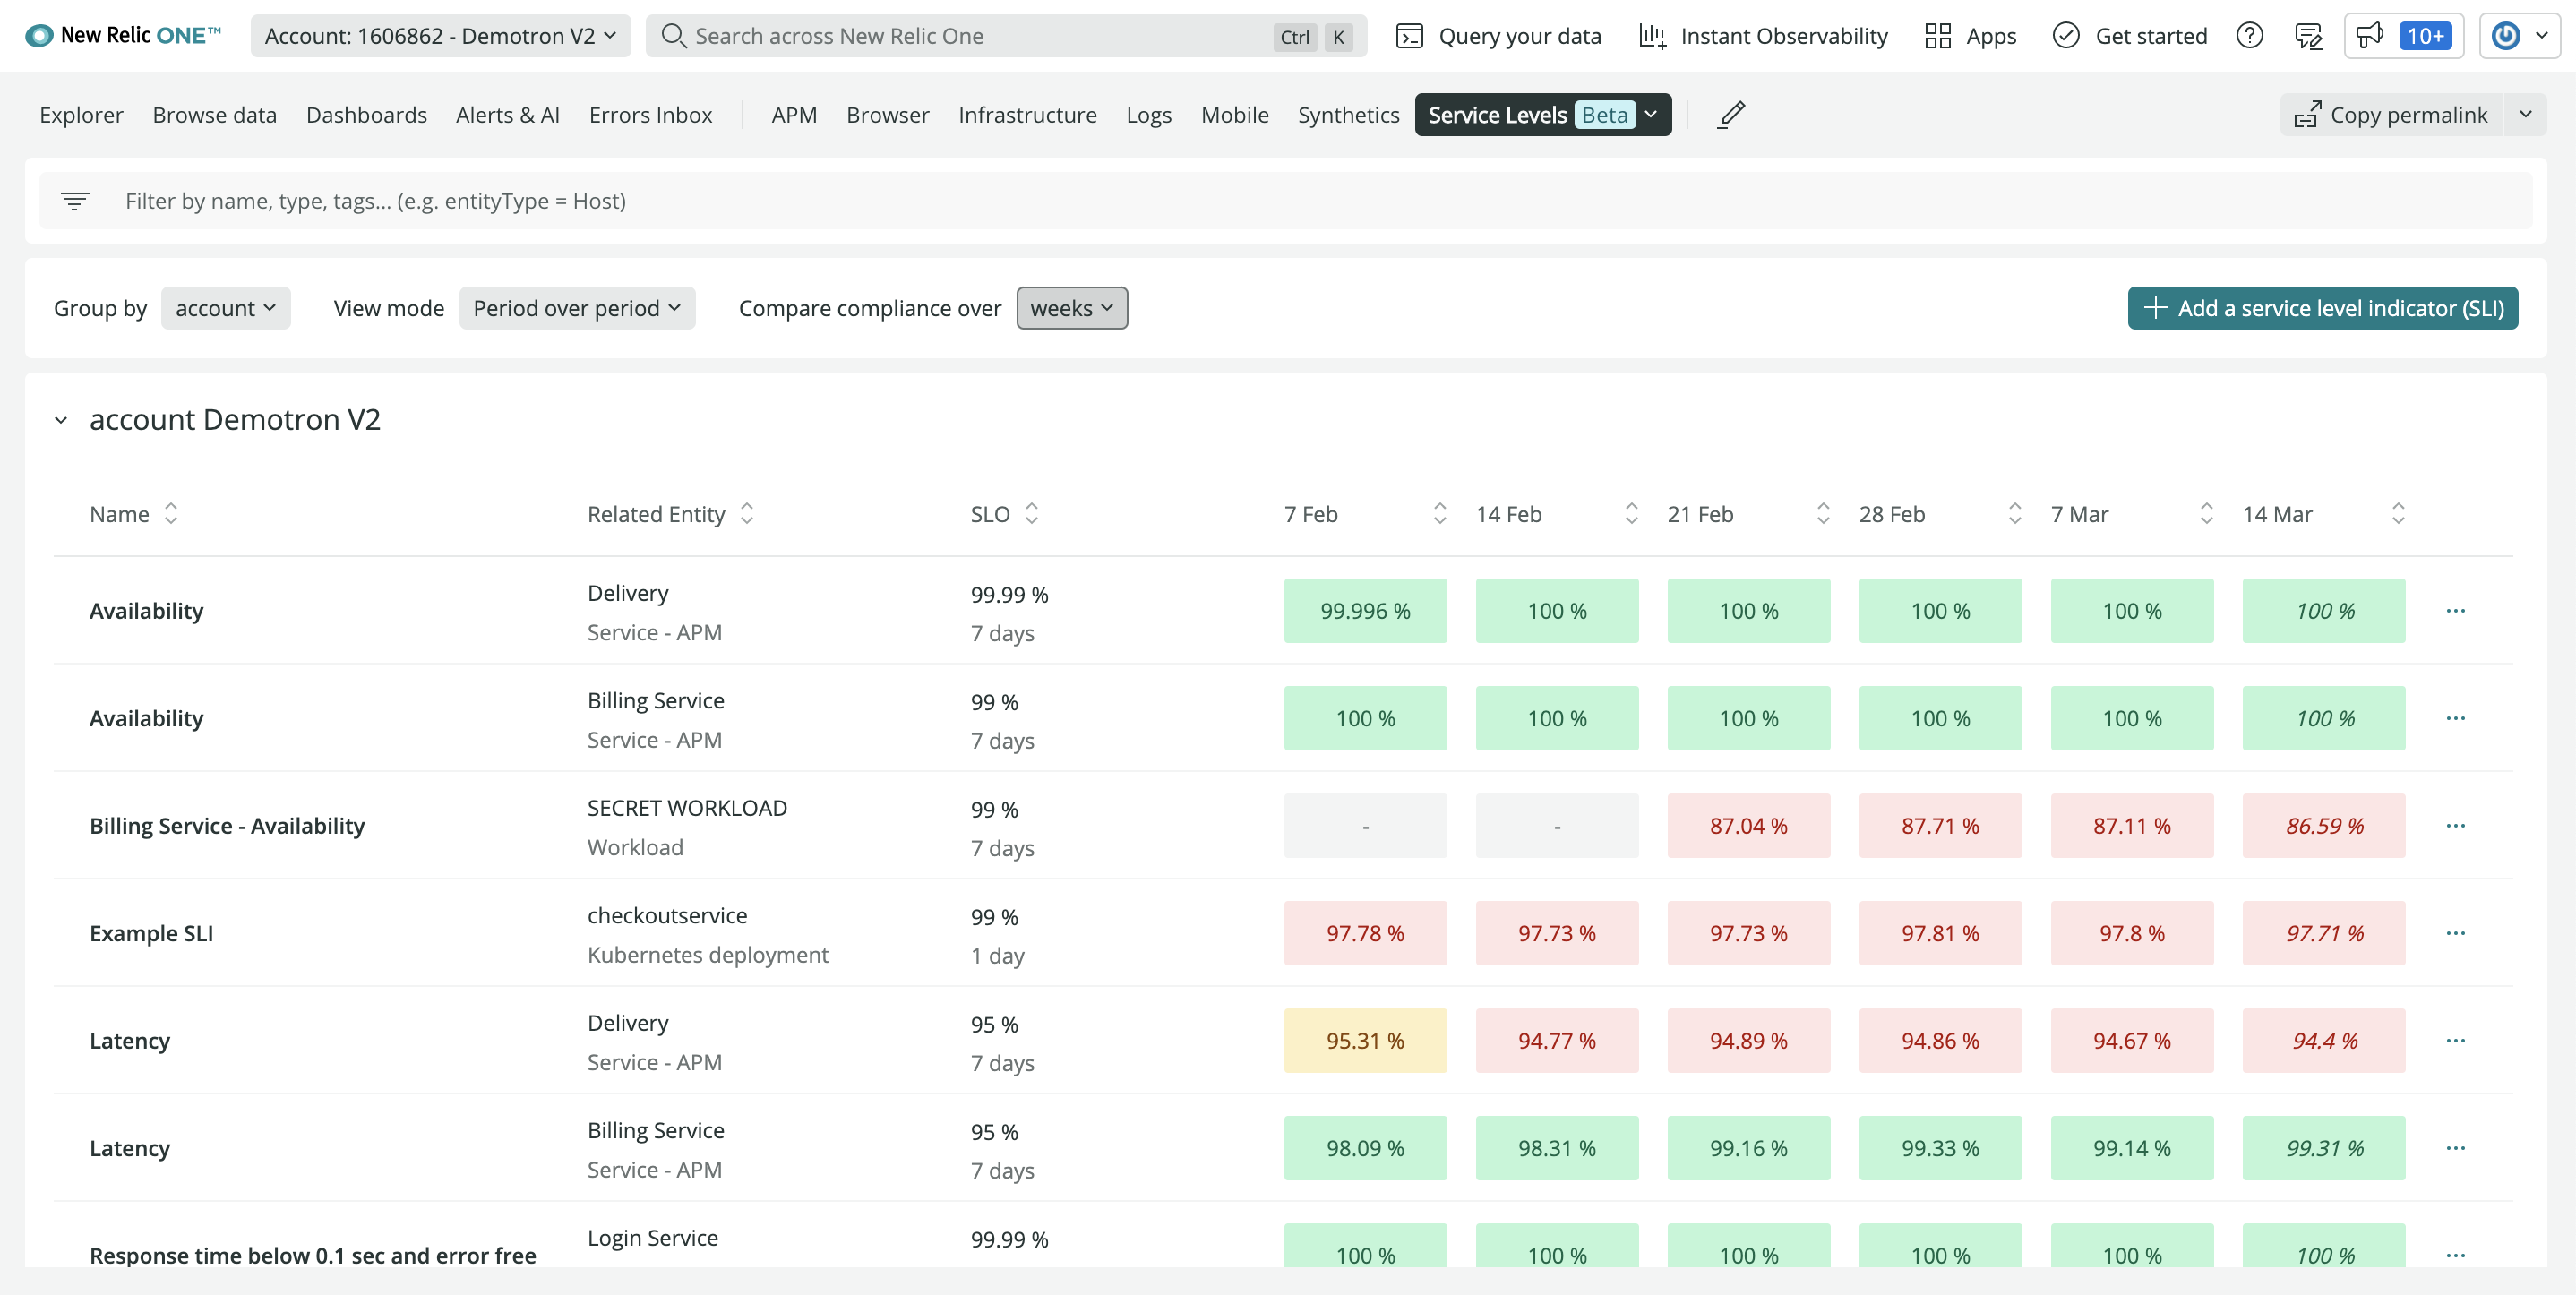
New Relic this week made a service level indicator (SLI) and service level objective (SLO) capability generally available within the New Relic One observability platform. The new capability makes it possible for DevOps teams to customize metrics, unified health reports and alerts.
Alex Kroman, general manager and senior vice president for product engineering for New Relic, said the goal is to enable DevOps teams to more easily optimize services that span multiple applications and software components at a time when more organizations are relying on software to drive digital business transformation initiatives.
IT teams have, of course, been tracking SLOs for decades. However, as application environments have become more distributed—thanks, in part, to the rise of microservices—achieving and maintaining SLOs has become more challenging. DevOps teams often lack an understanding of which metrics are most relevant to the business and even when they do, they have historically relied on manual processes and ad hoc tooling, noted Kroman.
In contrast, New Relic is providing those capabilities in a way that makes it simpler to manage service levels at no additional cost, he added. DevOps teams can, for example, create SLIs in one click to automatically establish a baseline of desired performance and reliability. The platform also provides recommendations based on historical data to both establish benchmarks and customize and configure SLIs and SLOs.
Those capabilities make it simpler to set service boundaries and track reliability across teams based on benchmarks, tags and reports that include bespoke views for both service owners and business leaders. In effect, via an application programming interface (API) exposed by New Relic, it becomes possible to employ dashboards to gain visibility across an entire business process, said Korman.

It’s still early days as far as the modernization of SLOs is concerned, but it’s clear that, over time, they will be managed as code along with everything else in a DevOps workflow. The more organizations become dependent on applications to drive digital business initiatives, the more critical it will become for DevOps teams to track SLOs. The decision that must be made is the degree to which it makes sense to manually implement some form of SLO-as-code versus relying on an observability platform that can be accessed as a cloud service.
Observability, of course, has always been a core tenet of DevOps. Few organizations are able to really achieve it, however, because most IT teams have been monitoring little more than a pre-defined set of metrics. Modern observability platforms make it easier for site reliability engineers (SREs) to launch queries against aggregated instances of metrics, logs and distributed traces to ascertain the root cause of an issue. The issue then becomes how to correlate the results of those queries against the service levels that businesses expect from a set of applications that might be driving, for example, an order-to-cash process. After all, knowing what occurred within an IT environment doesn’t always easily translate into a report that the average business executive can easily comprehend.


