This is the second in a series of blogs, partnering with Lee Reid, who wrote the first installment “The Simple Math of DevOps” and Sanjeev Sharma both of who are outstanding DevOps Thought Leaders from IBM.
I am picking up on Lee’s mathematical DevOps model to apply a calculus perspective, a “calculus of DevOps” if you will, (OK, not quite core Big Bang Theory Calculus but rather approaching it from the aspects of engineering queuing theory).
One of the cultural challenges that DevOps poses is, that some aspects of it run counter to engineering principles that many of us learned with respect to capacity and response time. When I worked at Bell Labs, we would apply queuing theory to determine how to best package information to be sent across the network. A basic premise revolved around a tradeoff between throughput and response time. On one hand, the more messages that were packed into the packet, the more the payload would improve capacity because the overhead of processing the packet of information would be spread across the messages. However, waiting to accumulate enough call processing information meant that the packets would be transmitted less frequently, increasing the response time.
A simple example of this would be making trips to the grocery store. If one wanted to spend the least amount of resources (time, gas, car wear, etc.) on shopping, then one would make less frequent trips and then buy a larger amount of food. So if the Smith family made one trip a month and spent 2 hours, then their average time per week spent on shopping would be 30 minutes. If the Jones family went every week and spent an hour, then they would be spending twice the time and four times the gas on grocery shopping. However if the Smith family run out of an item (say cereal), they would have to wait, on average 2 weeks before this was replenished. The Jones family average on any item that they ran out of would be 3.5 days in comparison.
So when the 2014 DevOps report was published[1] which states that areas that deploy more frequently get customer feedback more quickly, that is to be expected. But what’s not expected is that these organizations also have higher productivity. So exactly what is happening here that seems to be in a basic conflict to the principles of throughput and response time?
Keeping up with the JONESES
If we think of a pre- DevOps state for a medium to large enterprise, it may be typical for applications to only be released (deployed into production) a few times a year to provide business functionality. (I assume there are more frequent releases for “unplanned work” like defects and other changes or operational work). For the sake of this discussion, let’s call this the Smith Application. So from a business perspective, the business wants to pack as much work into the Smith releases as possible given they only have a few cracks a year at getting new business functionality into production.
SMITH APPLICATION CHARACTERISTICS:
- Deliver Business Value 3 times a year (every 4 months)
- Cost is C1
- Business Value (BV) delivered is V1
- Average time from concept (e.g. Story) being ready to be pulled from the backlog to the time it is delivered to the customer is 2 months plus any additional wait times (e.g. prioritization)
- BV delivered per year is 3*V1
- Cost per year is 3*C1
Now let’s transport over to the Jones Planet where the application is released into production with new business capabilities at the end of every 2 week iteration. In this case the business is more concerned with providing a constant demand flow into IT than they are with debating over whether a given feature/story is going to be included in this particular release. Instead there is a constant prioritization (or continuous planning) process that ensures the highest value work is being fed into the IT pipeline.
JONES APPLICATION CHARACTERISTICS:
- Deliver Business Value 26 times a year (every 2 weeks)
- Cost is C2
- BV delivered is V2
- Average time from concept (e.g. Story) being ready to be pulled from the backlog to the time it is delivered to the customer is 1 week plus any additional wait times
- BV delivered per year is 26*V2
- Cost per year is 26*C2
Based on the previous engineering analysis, we would expect the following:
- SMITH annual cost (3C1) < JONES Annual Cost (26C2)
- SMITH annual BV (3V1) > JONES annual BV (26V2)
So the tradeoff (we would believe) JONES is making by delivering more frequently is that they are spending more money and are delivering less business value on an annual basis.
However the data from the previously referenced DevOps report is just the opposite. In fact the findings are that enterprises that deploy smaller units of work more frequently have much higher quality and much higher productivity (Capacity). So what’s going on here?
A NEW PARADIGM
If you go up to any IT team (even an agile one) and ask them why they don’t deploy business value more frequently, they will generally refer to the following types of wait states of waste that they encounter:
- Waiting for work (lack of consistent flow)
- Waiting for somebody else to do something (dependencies from other teams)
- Waiting for environments (contention)
One major root cause of this is the dependencies that arise from large enterprises packing a lot of work into infrequent releases. From a planning perspective, the process is elongated due to prioritization discussions because being on the wrong side of the line can mean delay amounting to months, in delivering a product to a customer. Ask a business portfolio leader what their highest priority is for IT and I am guessing they can tell you in a matter of seconds. However, most large organizations can spend several months a year planning their annual portfolio of work for IT. Some organizations spend more than 50% of their new project build time prior to a single story entering an agile development team’s backlog!
From a development perspective, packing a lot of work into releases means many more dependencies that have to be managed across initiatives and impacted applications. From a testing perspective, downstream environments (ST, UAT) have to manage much more information in terms of application versions and especially test data that complicate and slow down the process. The complexity of test data increase is proportional to the number of pairwise relationships that exist within the datasets required for testing. As such, the testing complexity will increase non-linearly (perhaps proportional to the square of the dependent systems) and from a release and change perspective; there is a lot of coordination necessary given how much is being changed at one time.
All of this work to manage all of the dependencies found in medium to large enterprises completely eliminates any potential savings one might get from batching work into a single delivery. In addition, the possibility of having to pull some work out of a release (due to quality or business readiness or some other reason) sometimes leads to complicated source code management (feature branches in some cases) that further complicate the process of merging frequently into the trunk. These types of practices also serve to drive up technical debt. So looking at the problem from this angle shows why results we are seeing make perfect sense.
Productivity is inversely proportional to the number of dependencies in a release
As Lee related to in the initial blog, a lot of an organization’s success depends on trust. And one factor of trust is clarity which speaks to understanding the changes that each release is bringing to the IT and customer environments. So a factor that is working against trust is the notion of delivering more things less frequently and better controlling change somehow, is a good notion.
Trust is inversely proportional to the number of dependencies in a release
There is another hidden component of waste associated with “big bang” initiatives. Go back to our grocery example for a moment. Chances are that the Smith monthly excursion results in buying some stuff they end up not using. Perishable items are not spread out very well when they aren’t purchased more frequently. Likewise in IT planning, we tend to put a bunch of stuff in our IT Delivery basket that we don’t know for sure that we will need and we end up with a lot of wasted effort for features that are hardly used or not needed at all. Some enterprise estimates are that 50-65% of what they put into large releases does not actually result in true value to the business. Doing more frequent releases allows a constant discovery process to better guide the usage of IT resources on what is truly of value.
Waste is proportional to the size of a release.
In other words:
Yield (Value per IT investment) is proportional to the frequency of releases.
REVISTING THE MATH OF DELIVERY TIME
So if we revisit Lee’s model
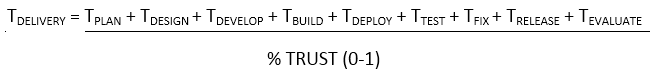 and apply the “Calculus of Release” as we stated above, there are increased costs associated with having larger and less frequent releases in medium/large enterprises.
- Planning cost TPLAN
- Development complexity TDESIGN + TDEVELOP + TBUILD
- Testing Complexity TTEST
- Release and Change Management Complexity TRELEASE + TDEPLOY + TEVALUATE
TRUST % – Even if everything was proportional between the JONES and SMITH models, the component of trust that impacts clarity, consistency and collaboration, is much lower for large (SMITH) releases. Given that TRUST has a multiplicative impact, this alone can account for the results found in the studies.
CULTURAL CHALLENGE
While clearly one needs to be sensitive to the changes being introduced into the business, having the ability for the business stakeholders to pull capability when they want it and having it available more frequently is not only good for customers but also has extreme benefits from an IT perspective in terms of increased productivity and reduction of technical debt. The challenge is to convince leaders in both the business and IT areas on the merits of doing more continuous planning and frequent deliveries. Unicorns may have led the way in this type of thinking but it is actually the horses that will benefit most from this type of culture shift because it is the horses[2] that have the most to gain in mitigating the dependency factor which can undermine quality, productivity and cycle times.
Read more about the topic in the next blog of this series The Art of DevOps by Sanjeev Sharma.
[1] “2014 State of DevOps Reports”, Puppet Labs, IT Revolution, https://puppetlabs.com/sites/default/files/2014-state-of-devops-report.pdf
[2] “The Phoenix Project”, Gene Kim, Kevin Behr, George Spafford, http://www.amazon.com/The-Phoenix-Project-Helping-Business/dp/0988262592
About the Author
 Carmen DeArdo is the Director of Application Development Tools and Technologies at Nationwide Insurance. Carmen is responsible for driving continuous delivery utilizing DevOps, Lean and Agile techniques across Mobile, Distributed and Mainframe and other technologies. This includes recommendations and implementation of technologies used across the development life cycle (e.g. IBM Rational tool suite, open source technologies).
