Whether migrating from a monolithic architecture or building a distributed system from ground zero, there are many benefits to leverage from a microservices architecture–faster software deployment cycles, enhanced scalability, improved isolation of risk. However, distributed systems are complex and as such, accompanied by many challenges, particularly when it comes to the scalability of metrics.
The Importance of Observability in Distributed Systems
In order to realize the benefits of a distributed system, a strategy of data-driven optimization is essential. The paradox here is visibility simplifies complexity, while the complexity of visibility is dramatically increased in distributed systems.
As New Relic points out in their eBook Cloud Native Is the New Normal, traditional monitoring approaches need to be adapted to meet the demands of decentralized architectures, including:
- Overcoming the loss of end-to-end monitoring capabilities by learning how to connect the dots across a complex network of environments.
- Developing tactics to quickly drill down into issues across interconnected parts to reduce mean time to resolution (MTTR).
- Introducing proactive reliability strategies that focus on measurement first, followed by improvement.
Finding the Right Balance Between Monitoring Nothing and Monitoring Everything
Most application engineers leverage some sort of metrics tooling such as Grafana, Prometheus or Graphite to track vitals for their system health. While monitoring is essential, there is such a thing as bloat when it comes to metrics ingestion; and this overload translates to scalability challenges that affect performance, cost and reliability.
So, how do you know what to monitor? In order to derive the most valuable insights from your system, you must first understand and identify the components, and more specifically which attributes within those components drive key metrics. Knowing this requires an intimate familiarity with how all the pieces work together in your distributed system.
Google’s Site Reliability Engineering book provides a framework for determining what to monitor in distributed systems. They break signals down into four different categories:


- Latency: Understand resource requirements and identify bottlenecks.
- Traffic: Monitor system response to varying levels of load; most useful when paired with other indicators.
- Errors: Track frequency and nature of interruptions in request/response flow.
- Saturation: Surface capacity-related issues.
Even when you’ve identified the most important metrics to track, scalability is still a challenge that must be addressed, particularly when dealing with applications that handle massive volumes of data across a complex application architecture.
M3: Uber’s Open Source Large-Scale Metrics Platform
A solution directly addressing the challenges of distributed metrics at scale is M3, an open source project developed by Uber’s engineering team.
Before using M3, the Uber team sent metrics to a Graphite stack with storage handled using the Whisper file format in a shared Carbon cluster. From there, they created Grafana dashboards to visualize the data and used Nagios for alerting based on Graphite threshold checks via source-controlled scripts. As the volume of metrics continued to expand, manual processes to scale the solution became unsustainable and repeat failures resulting in permanent data loss led them to build a more fault-tolerant, scalable system.
M3 is focused on providing a reliable storage solution for large-scale metrics over long retention periods, solving inherent single node-associated limitations with Prometheus by offering a multi-tenant store for Prometheus metrics. A key component of this solution is M3DB, the scalable storage backend for M3.
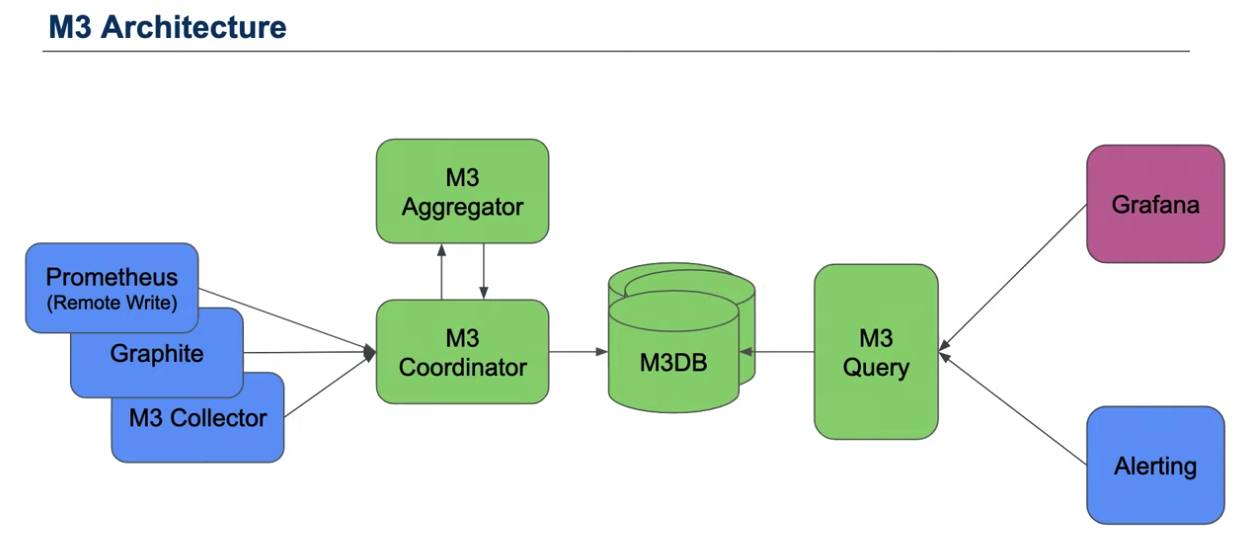
M3DB, built in Go, is a distributed time series store and reverse index with configurable out-of-order writes. By enabling the storage of real-time metrics over long periods of retention, M3DB can replace a Prometheus cluster. In developing the M3DB solution, the Uber team essentially deconstructed Prometheus into microservices to enable the scaling of each component individually. By taking this approach, M3DB is able to offer better reliability, efficiency and performance.
At a minimum, M3DB can be leveraged as remote storage for Prometheus (or used to replace any other remote storage solution). There are, however, other features the solution offers, including an external aggregation engine and a separate query engine.
The M3DB project is still under development with a growing community of contributors.
To learn more about containerized infrastructure and cloud native technologies, consider coming to KubeCon + CloudNativeCon NA, November 18-21 in San Diego.
