Editors note: This article represents the authors own opinions on the tools he mentions. We welcome others to join in the conversation about their opinions and experiences with these tools and similar ones. Important to note that they do not represent the opinion or beliefs of DevOps.com or its editors.
Recently I began looking for an application performance management solution for .NET. My requirements are code level visibility, end to end request tracing, and infrastructure monitoring in a DevOps production setup.
DotTrace is clearly the most well-known tool for code level visibility in development setups, but it can’t be used in a 24×7 production setup. DotTrace also doesn’t do typical Ops monitoring.
Unfortunately a Google search didn’t return much in terms of a tool comparison for .NET production monitoring. So I decided to do some research on my own. Following is a short list of well-known tools in the APM space that support .NET. My focus is on finding an end-to-end solution and profiler-like visibility into transactions.
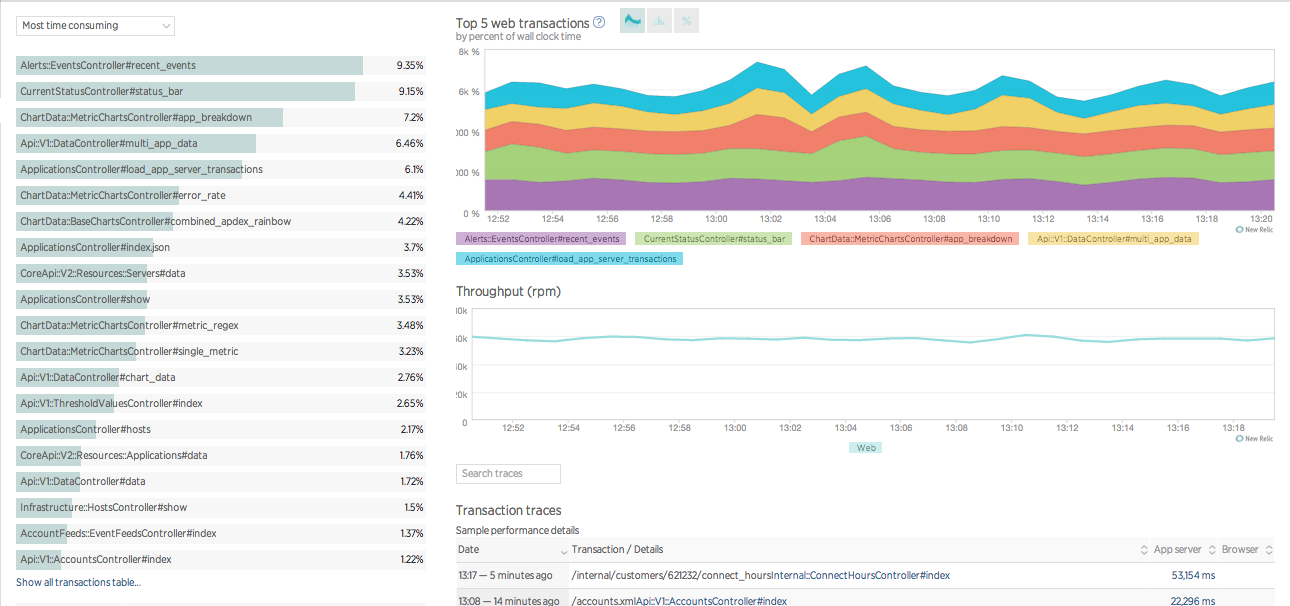
New Relic was the first to do APM SaaS, focused squarely on production with a complete offering. New Relic offers web request monitoring for .NET, Java, and more. It automatically shows a component-based breakdown of the most important requests. The breakdown is fairly intuitive to use and goes down to the SQL level. Code level visibility, at least for .NET, is achieved by manually starting and stopping sampling. This is fine for analyzing currently running applications, but makes analysis of past problems a challenge. New Relic’s main advantage is its ease of us, intuitive UI, and a feature set that can help you quickly identify simple issues. Depth is the main weakness of NewRelic. As soon as you try to dig deeper into the data, you’re stuck. This might be a minor point, but if you’re used to working with a profiler, you’ll miss CPU breakdown as New Relic only shows response times.
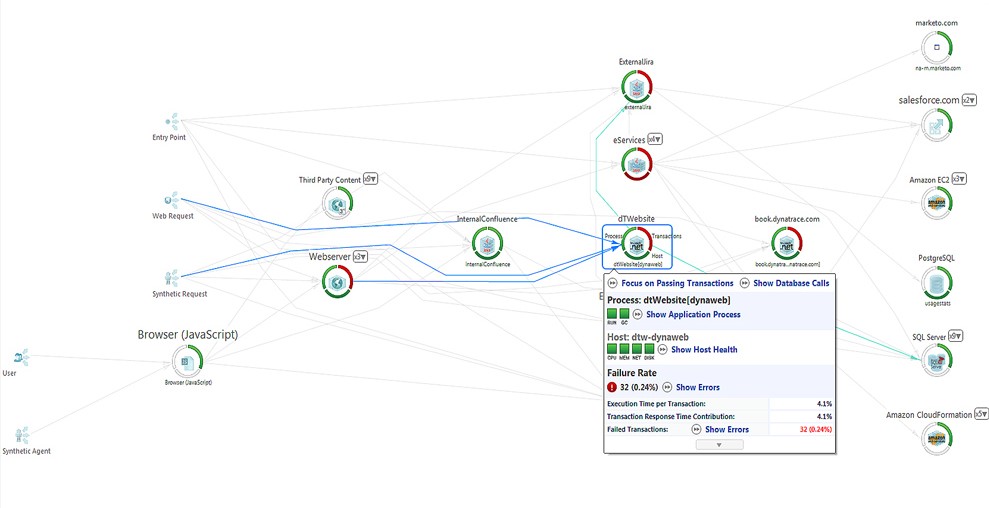
Dynatrace is the vendor that started the APM revolution and is definitely the strongest horse in this race. Its feature set in terms of .NET is the most complete, offering code level monitoring (including CPU and wait times), end to end tracing, and user experience monitoring. As far as I can determine, it’s the only tool with a memory profiler for .NET and it also features IIS web request insight. It supports the entire application life cycle from development environments, to load testing, to production. As such it’s nearly perfect for DevOps. Due to its pricing structure and architecture it’s targeted more at the mid to enterprise markets. In terms of ease of use it’s catching up to competition with a new Web UI. It’s rather light on infrastructure monitoring on its own, but shows additional strength with optional Dynatrace synthetic and network monitoring components.
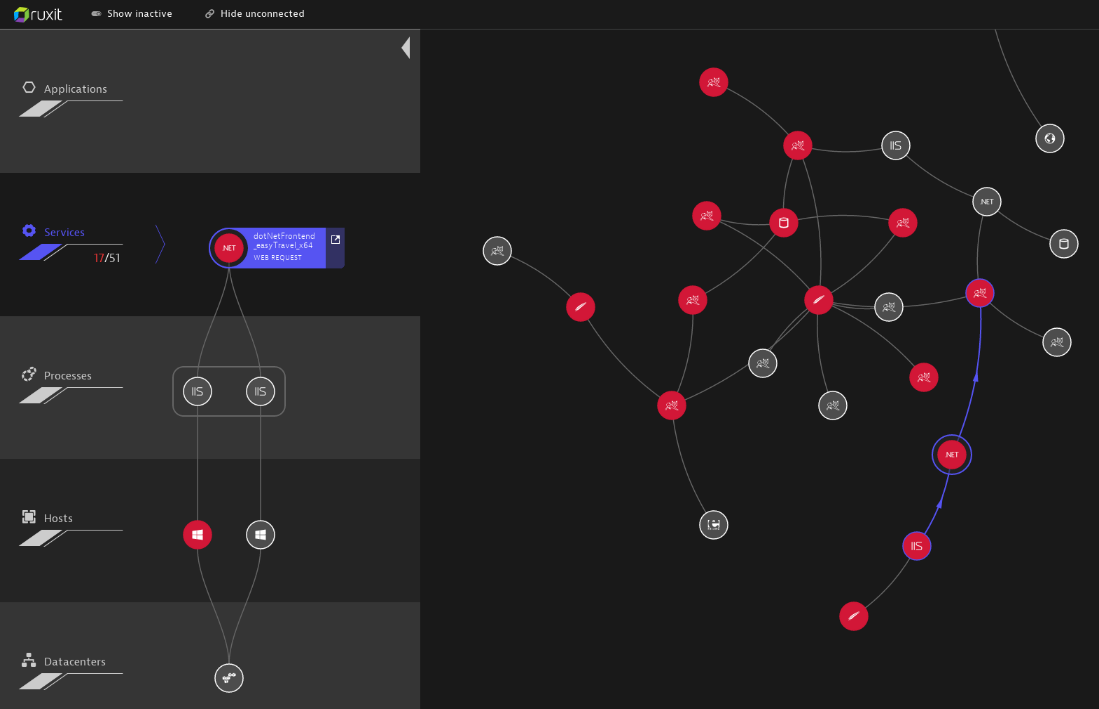
Ruxit is a new SaaS solution built by Dynatrace. It’s unique in that it unites application performance management and real user monitoring with infrastructure, cloud, and network monitoring into a single product. It is by far the easiest to install, literally takes 2 minutes. It features full end to end tracing, code level visibility down to the method level, SQL visibility, and RUM for .NET, Java, and other languages, with insight into IIS and Apache. Apart from this it has an analytics engine that delivers both technical and user experience insights. Its main advantages are its ease of use, web UI, fully automated root cause analysis, and frankly, amazing breadth. Its flexible consumption based pricing scales from startups, cloud natives, and mid markets up to large web scale deployments of ten-thousands of servers.
AppNetta‘s TraceView takes a different approach to application performance management. It does support tracing across most major languages including database statements and of course .NET. It visualizes things in charts and scatter plots. Even traces across multiple layers and applications are visualized in graphs. This has its advantages but takes some time getting used to it. Unfortunately while TraceView does support .NET it does not yet have code level visibility for it. This makes sense for AppNetta, which as a whole is more focused on large scale monitoring and has more of a network centric background. For DevOps in .NET environments however, it’s a bit lacking.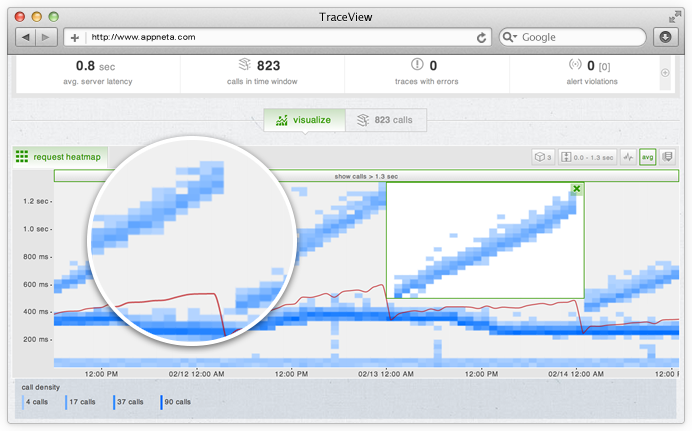
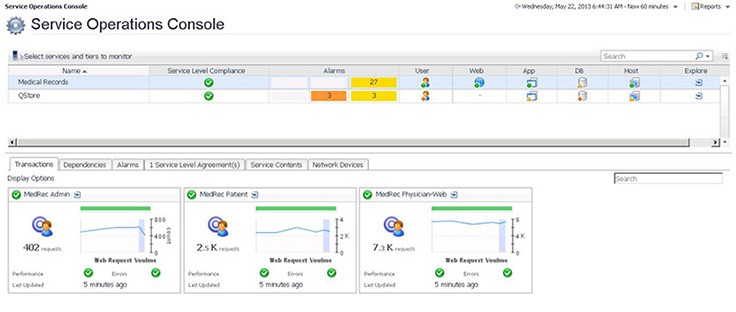
Foglight, originally owned by Quest and now owned by Dell, is a well-known application performance management solution. It is clearly meant for operations monitoring and tracks all web requests. It integrates infrastructure and application monitoring, end to end tracing, and code level visibility on .NET, among other things. It has the required depth, but it’s rather complex to set up and obviously generates alert storms as far as I could experience. It takes a while to configure and get the data you need. Once properly set up though, you get a lot of insight into your .NET application. In a fast moving DevOps scenario though it might take too long to manually adapt to infrastructure changes.
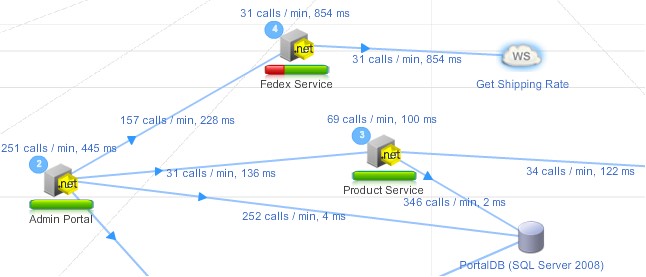
AppDynamics is well known in the APM space. Its offering is quite complete and it features .NET monitoring, quite nice transaction flow tracing, user experience, and code level profiling capabilities. It is production capable, though code level visibility may be limited here to reduce overhead. Apart from these features though, AppDynamics has some weaknesses, mainly the lack of IIS request visibility and the fact that it only features walk clock time with no CPU breakdown. Its flash-based web UI and rather cumbersome agent configuration can also be counted as negatives. Compared to others it’s also lacking in terms of infrastructure monitoring. Its pricing structure definitely targets the mid market.
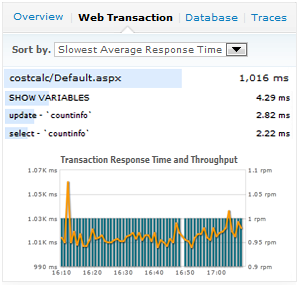
Manage Engine has traditionally focused on IT monitoring, but in recent years they added end user and application performance monitoring to their portfolio called APM Insight. Manage Engine does give you metric level insight into .NET applications and transaction trace snap shots which give you code level stack traces and database interactions. However it’s apparent that Manage Engine is a monitoring tool and APM insight doesn’t provide the level of depth one might be accustomed to from other APM tools and profilers.
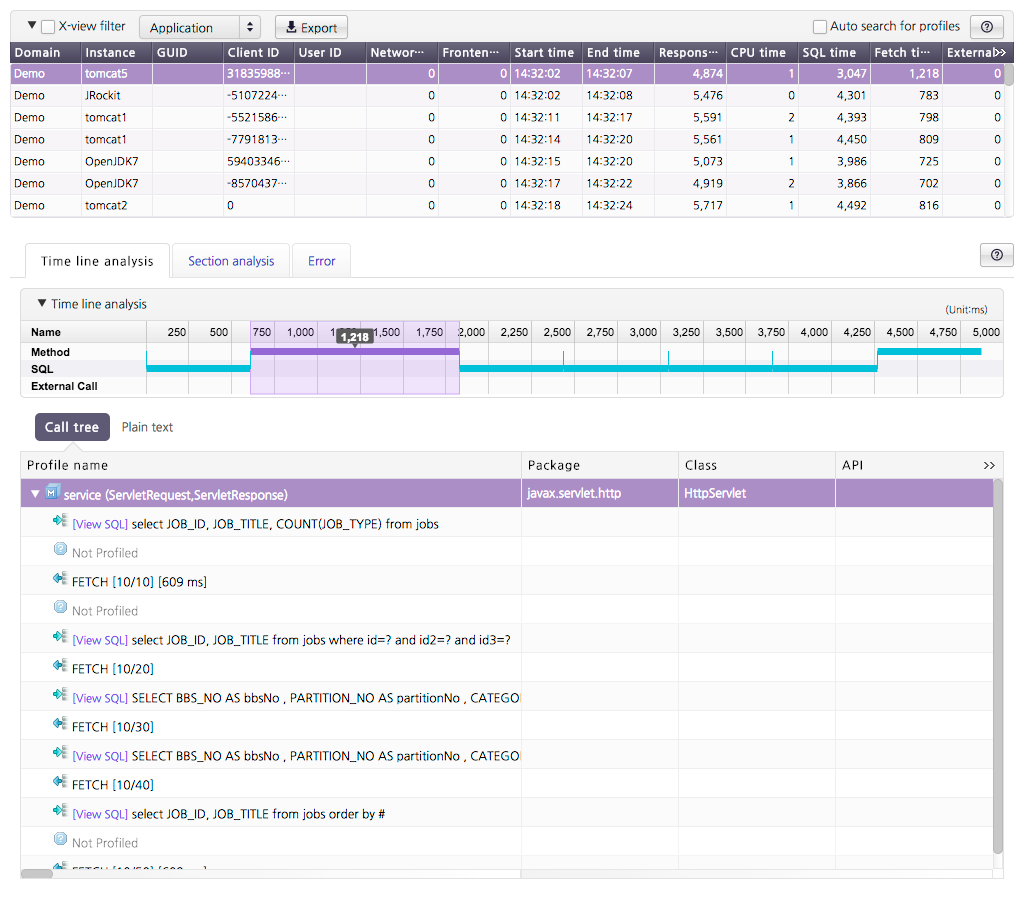
JenniferSoft is a monitoring solution that provides nice real-time dashboarding and gives an overview of the topology of your environment. It enables users to see deviations in the speed of transactions with real time scatter charts and analysis of transactions. It provides “profiling” for IIS/.NET transactions, but only on single tiers and has no transaction tracing. Their strong suit is clearly cool dashboarding but not necessarily analytics. For example, they are the only vendor that features 3D animated dashboards.
Conclusion: There’s more buzz around on the APM space than a Google search would reveal on first sight and I did actually discover some cool vendors to target my needs; however, the field clears up pretty much when you dig for end-2-end visibility from code down to infrastructure, including RUM, any web service requests and deep SQL insights. And if you want to pair that with a nice, fluent, ease-of-use web UI and efficient analytics, there’s actually not many left …
About the Author/ Thomas Kunz:
 I am an innovation architect focusing on IT in the context of the disruptive changes through the convergence of Social, Mobile, Information and Cloud and digital business transformations. After more than 20 years of experiencing one of the biggest IT enterprises in the world and its projects, programs and people, I am now helping customers overcoming the challenges through the omnipresent trend of digitalization. Follow me here http://twitter.com/@thom1309 or find me at my blog http://blog.smile-it.at or at http://www.productwings.com
