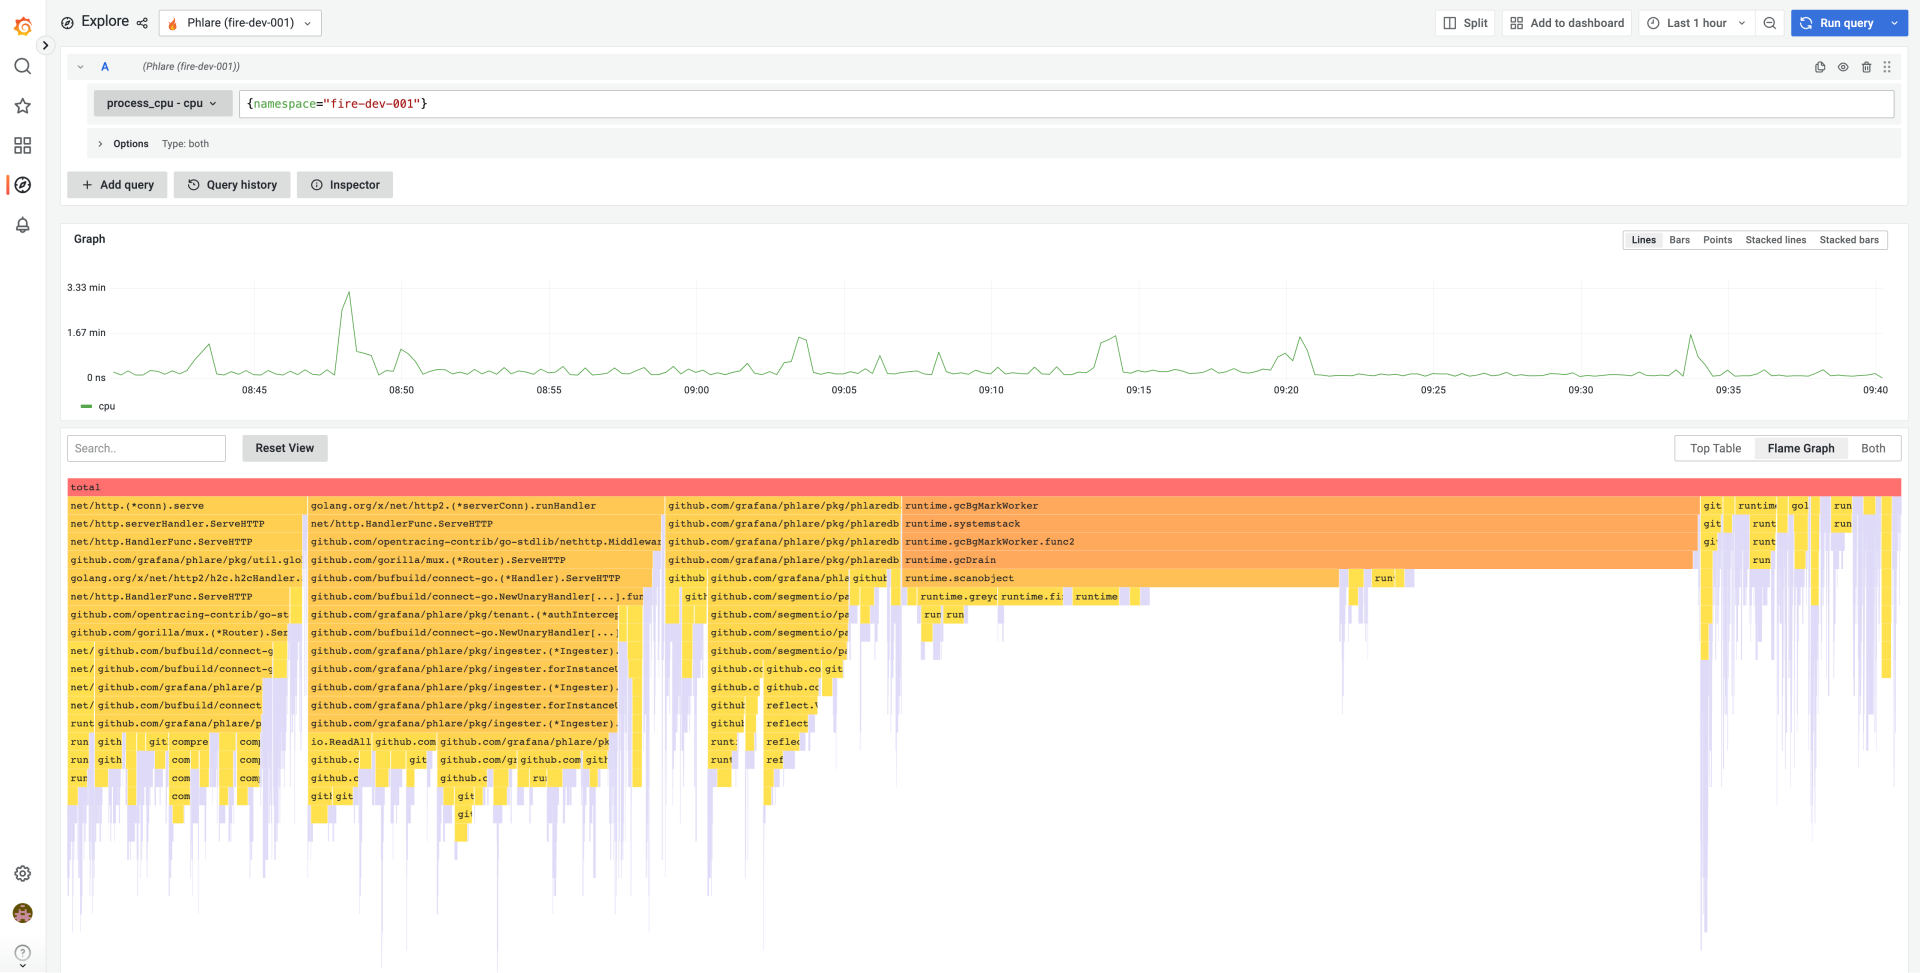
Grafana Labs this week announced it acquired Pyroscope and plans to merge Pyroscope’s open source continuous profiling project with the open source continuous profiling database that Grafana Labs launched last year.
Richard Hartmann, director of community at Grafana Labs, said after logs, metrics and traces, continuous profiling is now the fourth pillar of observability that enables DevOps teams to identify how much infrastructure resources any given piece of code is consuming. That capability is critical for everything from controlling costs to improving performance to limiting the amount of carbon generated by an application both before and after an application is deployed, he added.
The resulting Grafana Pyroscope project will be natively integrated with Grafana Labs’ open source dashboard project to make it simpler to visualize profiling data and correlate it with metrics, logs, and traces. Grafana Labs is also committing to adding profiling capabilities to the fully managed Grafana Cloud observability platform.

Pyroscope currently makes a plug-in for Grafana available in addition to a cloud instance of Pyroscope. Integrating Pyroscope with the Grafana Labs portfolio will make it simpler for DevOps teams to visualize issues before there is a major disruption to an application environment, said Hartmann.
It’s still early days as far as the adoption of observability platforms is concerned, but it’s apparent that as application environments become more complex, the plethora of monitoring tools that DevOps teams rely on will need to be streamlined. Observability platforms promise to unify logs, metrics and traces in a way that makes it simpler to launch queries to identify the root cause of an issue. The rate at which DevOps teams will embrace observability will naturally vary, but the biggest obstacle might not be the platforms themselves. Instead, the issue is understanding what queries can help DevOps teams better understand the root cause of an IT issue. Visualization tools, in combination with code profiling tools such as Pyroscope, should make it simpler to surface those issues.
Grafana Labs is also enabling organizations to better address sustainability concerns that have emerged as more policies are enacted to encourage organizations to reduce the overall size of their carbon footprints. The European Union, especially, has been enacting policies that provide organizations with a range of incentives to encourage greater efficiency from IT environments. It won’t be long before more DevOps tools and platforms provide greater visibility and control over the amount of infrastructure application code is consuming to achieve sustainability goals.
In the meantime, overall observability should continue to improve as organizations move beyond continuous monitoring to gain insights into how application environments are behaving. As IT environments become more complex, tools that monitor a set of pre-defined metrics are no longer enough to ensure application resiliency. The challenge—and the opportunity—is to determine how to take observability to the next level before the next inexplicable application performance degradation.


