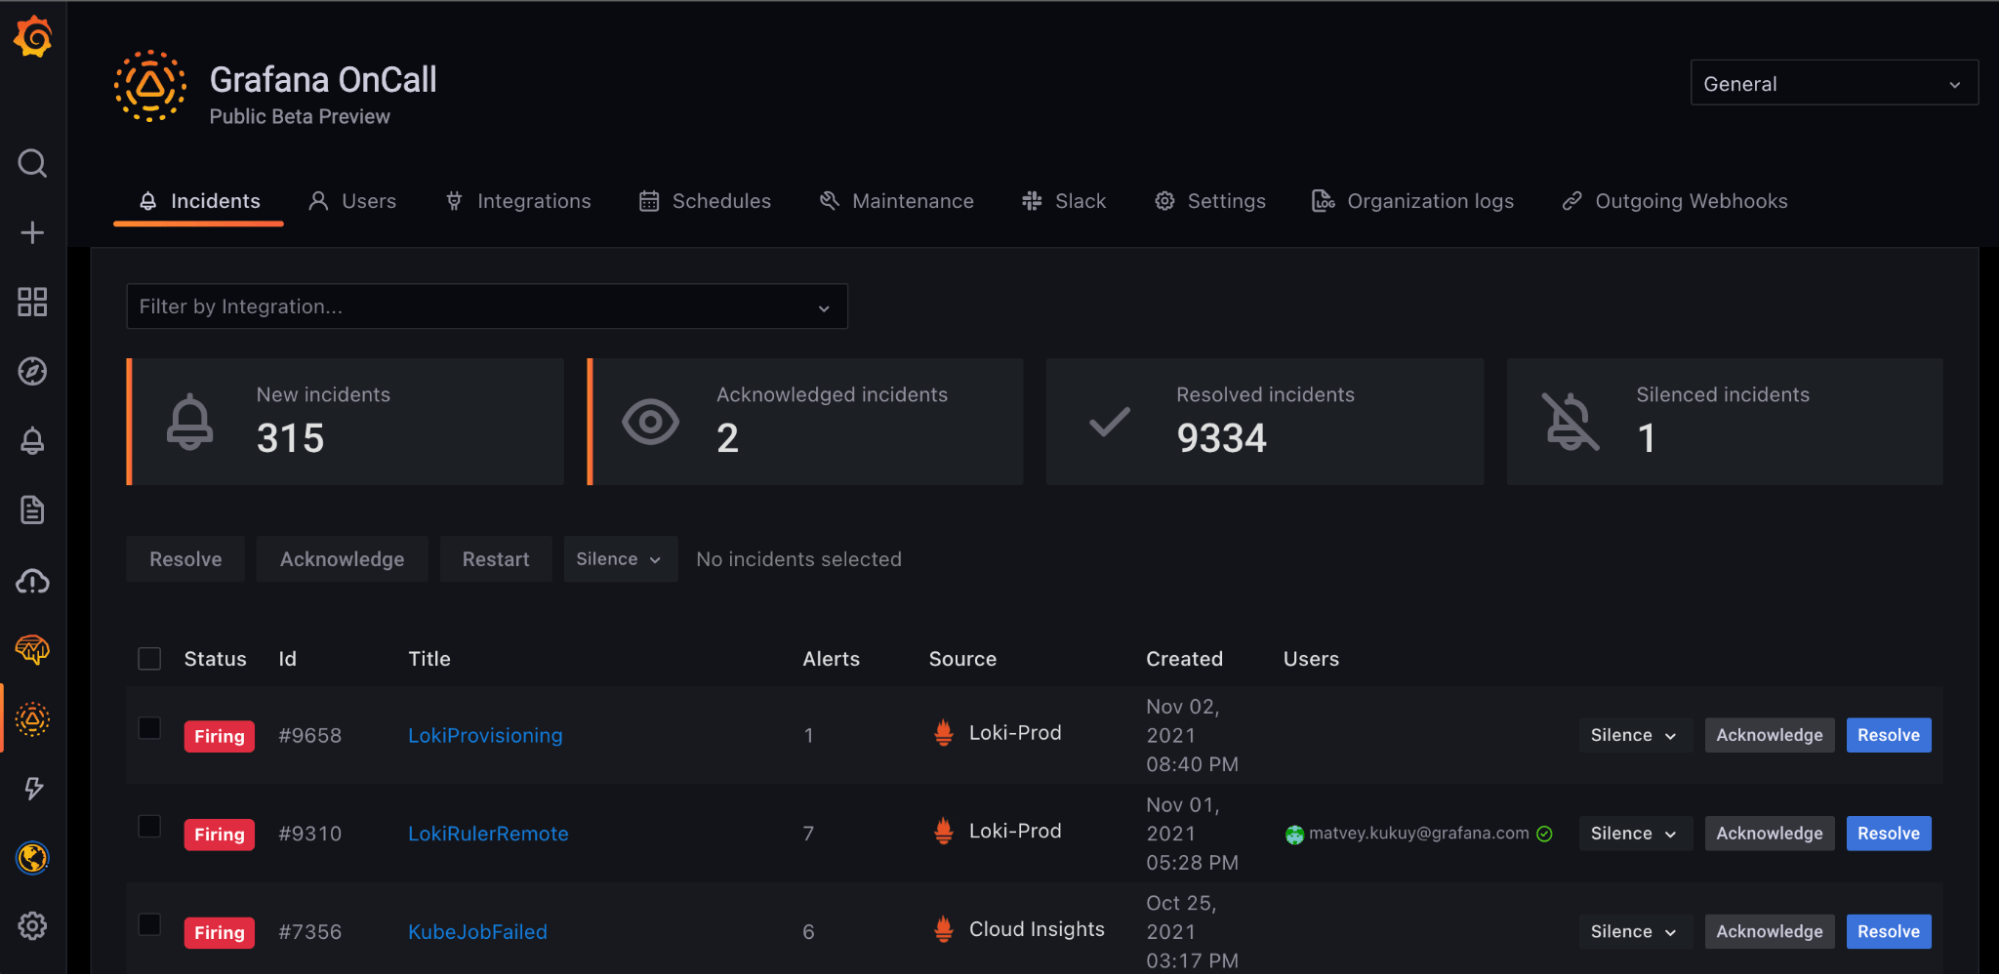
During its online ObservabilityCON 2021 conference, Grafana Labs this week previewed an incident management platform in addition to making available an on-premises edition of its distributed tracing tool.
Tom Wilkie, vice president of product for Grafana Labs, said the Grafana OnCall incident management platform is a natural extension of the observability tools the company already provides using the widely employed open source Grafana dashboard. The platform, which is expected to be generally available in 2022, is based on software Grafana Labs gained by acquiring Amixr earlier this year.
Grafana OnCall unifies all the alerts created by Grafana, Prometheus and the Alertmanager tool the Prometheus community created to streamline the number of alerts generated by the platform. The goal is to reduce the alert fatigue a DevOps team might experience when dealing with an IT issue that can be traced back to a single root cause, noted Wilkie.

At the same time, Grafana Labs made Grafana Enterprise Traces available for on-premises IT environments. It is based on Grafana Tempo, a cloud service that makes it possible to store and then analyze distributed traces using inexpensive object storage resources. The latest version of the core open source Tempo project has also been updated to add service graphs and the ability to search recent traces.
Grafana Labs this week also updated Loki, an open source log management platform, to add support for out-of-order log lines, custom log retention policies per log stream and per tenant and a deletion API that makes it easy to scrub log data. Version 2.4 of Loki also adds additional high-availability capabilities.
Other updates to the Grafana Labs platform include support for recorded queries, a set of pre-built dashboards that enable users to quickly drill into their Prometheus metrics data, the ability to consume metrics from the AWS CloudWatch service provided by Amazon Web Services (AWS), improvements to its ability to monitor Kubernetes clusters and updates to the open source load testing tool the company gained by acquiring k6 last year.
Grafana Labs is also committing to expanding its integration with Microsoft Azure cloud service alongside its integrations with AWS, noted Wilkie.
While competition among providers of observability platforms is already fierce, Wilkie said an observability platform based on an open source dashboard that can already collect data from more than 100 sources provides a unique advantage. At the core of the Grafana Labs platform is a centralized framework for collecting data generated primarily by the open source Prometheus monitoring platform being developed under the auspices of the Cloud Native Computing Foundation (CNCF).
While Prometheus is used most often in Kubernetes environments, it is starting to gain traction in monolithic application environments as well; it provides an open source approach to defining a de facto standard for collecting metrics and other data that can be consumed by an observability platform.
It’s not clear yet to what degree IT teams are distinguishing between monitoring and observability. Monitoring focuses on predefined metrics to identify when a specific platform or application is performing within expectations. Observability combines metrics, logs and traces to instrument applications in a way that makes it simpler to troubleshoot issues without relying solely on a limited set of metrics that are pre-defined and monitor a specific process or function.
Regardless of whether IT teams view observability as being distinct from monitoring, it’s clear that the ability to manage IT environments is improving at a rapid rate. The challenge, of course, is the IT environment itself is becoming more complex with each passing day.