DevOps.com

  • Latest
    • Articles
    • Features
    • Most Read
    • News
    • News Releases
  • Topics
    • AI
    • Continuous Delivery
    • Continuous Testing
    • Cloud
    • Culture
    • DataOps
    • DevSecOps
    • Enterprise DevOps
    • Leadership Suite
    • DevOps Practice
    • ROELBOB
    • DevOps Toolbox
    • IT as Code
  • Videos/Podcasts
    • Techstrong.tv Podcast
    • Techstrong.tv - Twitch
    • DevOps Unbound
  • Webinars
    • Upcoming
    • Calendar View
    • On-Demand Webinars
  • Library
  • Events
    • Upcoming Events
    • Calendar View
    • On-Demand Events
  • Sponsored Content
  • Related Sites
    • Techstrong Group
    • Cloud Native Now
    • Security Boulevard
    • Techstrong Research
    • DevOps Chat
    • DevOps Dozen
    • DevOps TV
    • Techstrong TV
    • Techstrong.tv Podcast
    • Techstrong.tv - Twitch
  • Media Kit
  • About
  • Sponsor
  • AI
  • Cloud
  • CI/CD
  • Continuous Testing
  • DataOps
  • DevSecOps
  • DevOps Onramp
  • Platform Engineering
  • Sustainability
  • Low-Code/No-Code
  • IT as Code
  • More
    • Application Performance Management/Monitoring
    • Culture
    • Enterprise DevOps
    • ROELBOB
Hot Topics
  • How to Build Successful DevOps Teams
  • Five Great DevOps Job Opportunities
  • Serial Entrepreneur
  • Chronosphere Adds Professional Services to Jumpstart Observability
  • Friend or Foe? ChatGPT's Impact on Open Source Software

Home » Blogs » Application Performance Management/Monitoring » Grafana Labs Looks to Simplify Observability

Grafana Labs Looks to Simplify Observability

Avatar photoBy: Mike Vizard on October 26, 2020 2 Comments

Grafana Labs, at its online ObservabilityCON conference today, unveiled a distributed tracing platform dubbed Grafana Tempo that makes it possible to leverage existing object storage platforms and services to analyze traces.

Recent Posts By Mike Vizard
  • Five Great DevOps Job Opportunities
  • Chronosphere Adds Professional Services to Jumpstart Observability
  • VMware Streamlines IT Management via Cloud Foundation Update
Avatar photo More from Mike Vizard
Related Posts
  • Grafana Labs Looks to Simplify Observability
  • Grafana Labs Expands into Incident Management Realm
  • Grafana Labs Adds On-Premises Observability Platform
    Related Categories
  • Application Performance Management/Monitoring
  • Blogs
    Related Topics
  • grafana
  • Loki
  • observability
  • open source
Show more
Show less

At the same time, Grafana Labs announced version 2.0 of Loki, which normalizes different structured, unstructured or JSON log formats in a way that allows DevOps teams to extract additional labels as well as enable additional filtering and grouping. IT teams are also not required to define labels in advance and store those labels in the database.

Cloud Native NowSponsorships Available

A Loki 2.0 query can also be used to directly generate an alert statement using a new distributed rules evaluation engine. Previously, Loki would have to have been configured as a Prometheus data source, which then would allow the distributed instance of Prometheus, dubbed Grafana, to generate alerts.

Tom Wilkie, vice president of product for Grafana Labs, says Loki 2.0 also serves to make the database employed to observe events in real-time smaller, resulting in faster queries. The result is an approach to analyzing log data that is significantly less expensive than legacy platforms, he said, noting DevOps teams should expect to see Grafana Labs also use Loki to address security use cases.

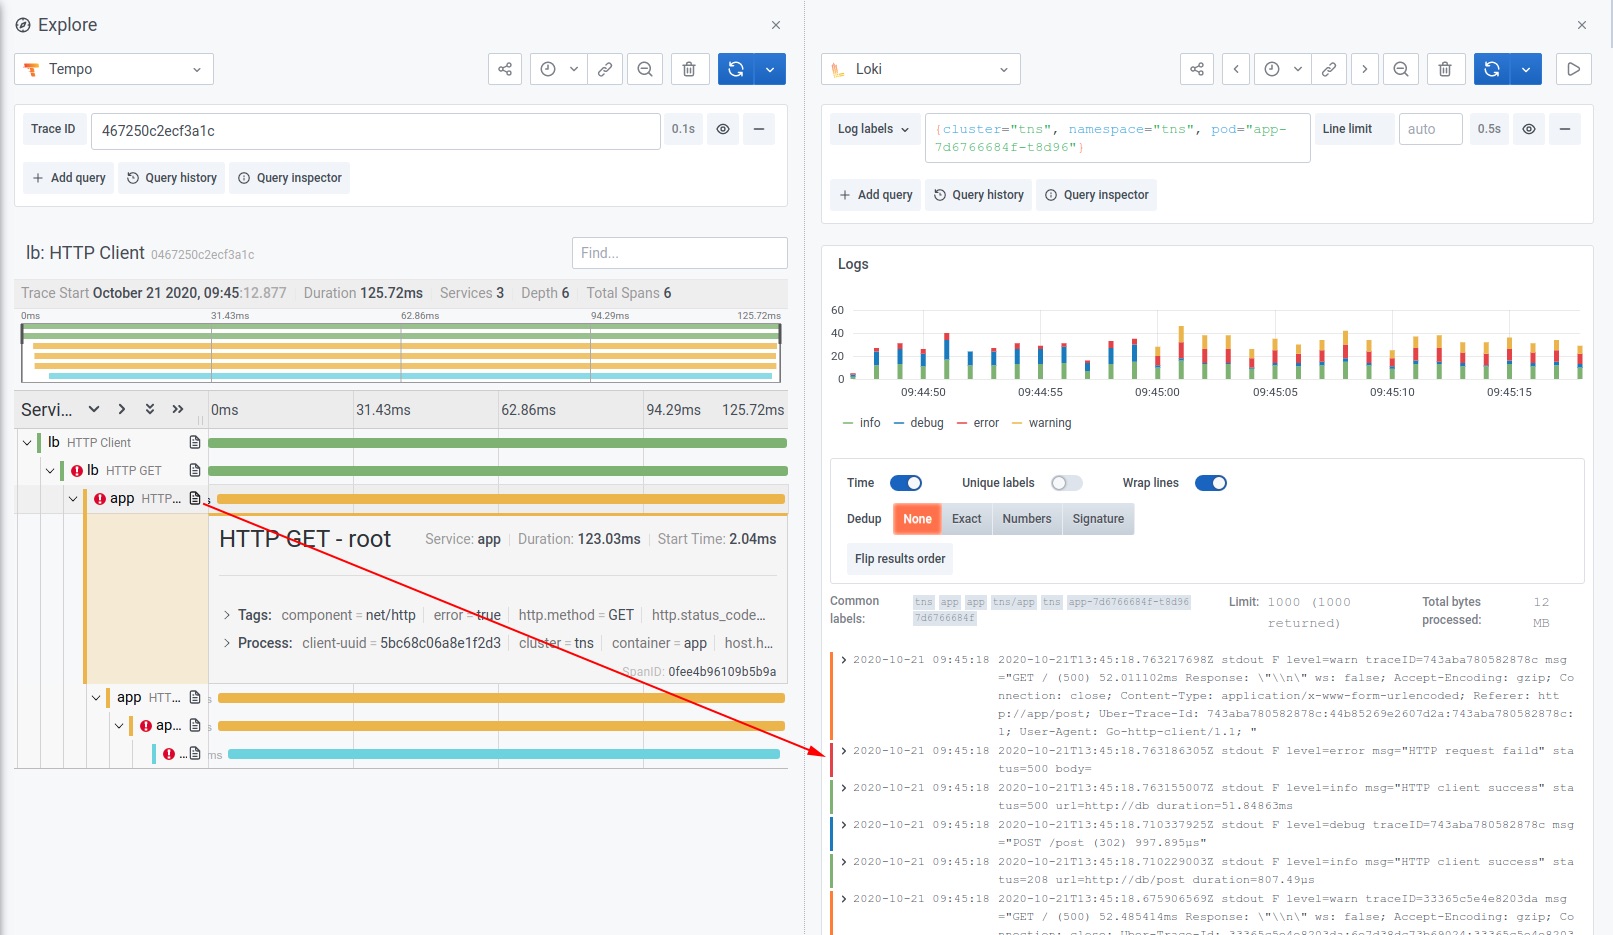
Wilkie said both Loki and Grafana Tempo are intended to reduce the barriers to achieving observability in a way that doesn’t require nearly as much time, effort and skills on the part of a DevOps team. Grafana Tempo supports the same Tempo data discovery engine employed by Loki and the open source Prometheus monitoring platform and the Grafana platform built on top of Prometheus. That level of integration makes it easier for IT teams to narrow in on a specific trace using open source tracing protocols such as Jaeger, Zipkin and OpenTelemetry. Users of the platform can jump from log to trace and back again easily, he said.

There is also no need to set up and maintain a separate index that IT teams must maintain, Wilkie added. In addition, Tempo is compatible with object storage systems commonly found on cloud services, so the total cost of achieving observability drops significantly compared to platforms that rely on a proprietary database, he said.

Despite observability being a core tenet of DevOps, it remains an elusive goal for most IT organizations. There is no shortage of tools for monitoring individual applications and systems, but aggregating all the data the tools generate into actionable intelligence requires a significant amount of time and effort. Loki makes it much easier to analyze the relevant logs at the right time in a way the average IT administrator can navigate without having to become a superuser of more complex platform, said Wilkie.

It’s too early to say how the observability wars will play out. The good news from an IT perspective is at least now there is no shortage of options.

Filed Under: Application Performance Management/Monitoring, Blogs Tagged With: grafana, Loki, observability, open source

« Survey Sees Surge in Demand for DevOps Skills
From ‘Cloud Zombies’ to Multi-Cloud Experts »

Techstrong TV – Live

Click full-screen to enable volume control
Watch latest episodes and shows

Upcoming Webinars

Securing Your Software Supply Chain with JFrog and AWS
Tuesday, June 6, 2023 - 1:00 pm EDT
Maximize IT Operations Observability with IBM i Within Splunk
Wednesday, June 7, 2023 - 1:00 pm EDT
Secure Your Container Workloads in Build-Time with Snyk and AWS
Wednesday, June 7, 2023 - 3:00 pm EDT

GET THE TOP STORIES OF THE WEEK

Sponsored Content

PlatformCon 2023: This Year’s Hottest Platform Engineering Event

May 30, 2023 | Karolina Junčytė

The Google Cloud DevOps Awards: Apply Now!

January 10, 2023 | Brenna Washington

Codenotary Extends Dynamic SBOM Reach to Serverless Computing Platforms

December 9, 2022 | Mike Vizard

Why a Low-Code Platform Should Have Pro-Code Capabilities

March 24, 2021 | Andrew Manby

AWS Well-Architected Framework Elevates Agility

December 17, 2020 | JT Giri

Latest from DevOps.com

How to Build Successful DevOps Teams
June 5, 2023 | Mariusz Tomczyk
Five Great DevOps Job Opportunities
June 5, 2023 | Mike Vizard
Chronosphere Adds Professional Services to Jumpstart Observability
June 2, 2023 | Mike Vizard
Friend or Foe? ChatGPT’s Impact on Open Source Software
June 2, 2023 | Javier Perez
VMware Streamlines IT Management via Cloud Foundation Update
June 2, 2023 | Mike Vizard

TSTV Podcast

On-Demand Webinars

DevOps.com Webinar ReplaysDevOps.com Webinar Replays

Most Read on DevOps.com

No, Dev Jobs Aren’t Dead: AI Means ‘Everyone’s a Programmer’? ¦ Interesting Intel VPUs
June 1, 2023 | Richi Jennings
What Is a Cloud Operations Engineer?
May 30, 2023 | Gilad David Maayan
Forget Change, Embrace Stability
May 31, 2023 | Don Macvittie
Five Great DevOps Job Opportunities
May 30, 2023 | Mike Vizard
Revolutionizing the Nine Pillars of DevOps With AI-Engineered Tools
June 2, 2023 | Marc Hornbeek
  • Home
  • About DevOps.com
  • Meet our Authors
  • Write for DevOps.com
  • Media Kit
  • Sponsor Info
  • Copyright
  • TOS
  • Privacy Policy

Powered by Techstrong Group, Inc.

© 2023 ·Techstrong Group, Inc.All rights reserved.