syslog-ng, riemann, collectd-notifications, elasticsearch: putting it all together
Context
At our organization (CCIN2P3) we are building an event-based infrastructure to push structured messages to different subsystems for alerting, reporting and storage. Using syslog-ng, each message is normalized into a structured event, optionally correlated with other messages, and conditionally routed to the next systems, including:
- a synchronous web-dashboard,
- different asynchronous alerting systems, and
- a searchable storage backend.
The events which are collected are essentially system and application logs. Here’s a few examples of interesting messages:
puppet-agent[16528]: Finished catalog run in 44.06 secondskernel: Killed process 29959, UID 42046, (hadd) total-vm:202363492kB, anon-rss:13069860kB, file-rss:60kBata2.00: exception Emask 0x0 SAct 0xffff SErr 0x0 action 0x0EXT3-fs error (device dm-1): ext3_journal_start_sb: Detected aborted journalThe unified nature of this pipeline makes it possible for a human to easily identify an event in all the available back- and frontends.
In this post you’ll learn a way to implement this model, and achieve the following:
- Collect system metrics
- Monitor events for outliers
- Normalize and Correlate these events
- Route the events to a real-time stream processor and to a searchable storage backend
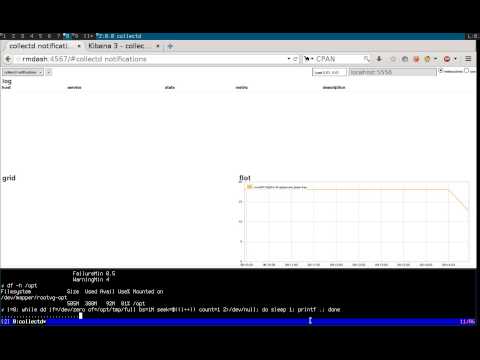
We’ll describe the configuration files you’ll have to change, and explain the workflow that processes an event. For the impatient, we’ll illustrate the final result in a short recorded demo.
Demo
Requirements
We will assume you have basic knowledge of the following tools, as well as a running instance of each:
- syslog-ng Open Source Edition >= 3.5
- syslog-ng-incubator >= 0.2.1
- riemann >= 0.2.5
- collectd >= 5.1
- Elasticsearch >= 0.90
The tools
Here’s a list of all the tools we’ll be using, along with a short summary, and their main functions in the pipeline:
On the client:
- collectd: “a daemon that receives system statistics and makes them available in a number of ways”
- periodically poll system metrics
- trigger notifications based on predefined thresholds
- (any)syslog: “system error logging protocol”
- listen for syslog messages, including collectd notifications
- forward them to a remote destination
On the server(s):
- syslog-ng: “a flexible and highly scalable system logging application”
- listen for remote notification messages
- patterndb: create structured events by parsing the flat collectd notification messages
- route the events to the next stages (riemann, Elasticsearch, Nagios, Email, …)
- riemann: “aggregates events from your servers and applications with a powerful stream processing language”
- listen for remote structured messages (protocol-buffers)
- expose a websocket and/or sse service for subscriptions
- send asynchronous alerts to the next stages (e.g. Nagios or Email)
- riemann-dash: “a javascript, websockets-powered dashboard for Riemann”
- synchronous realtime in-browser display
- web application to subscribe to collectd streams using websockets or sse
- elasticsearch: “a flexible and powerful open source, distributed, real-time search and analytics engine”
- store and index all events
- expose an API for query e.g. by Kibana
- “You know, for search!“
- kibana: “Elasticsearch’s data visualization engine for the browser”
- browser-based search interface to query elasticsearch
Architecture
To make things crystal-clear, we’ll choose an example: let’s track filesystem’s usage. The collectd-df plugin collects this information. Here’s a diagram depicting the dataflow: you can follow how an event is evolving from a user perspective on the left column, as it travels the pipeline (right column):

And the details:
- collectd-df plugin polls the filesystem utilization:
df-tmp/percent_bytes-freeis1.9 - collectd-threshold plugin issues a notification as the failure threshold is reached:
Notification: severity = FAILURE, host = foo, plugin = df, plugin_instance = tmp, type = df_complex, type_instance = free, message = Host foo, plugin df (instance tmp) type df_complex (instance free): Data source "value" is currently 1.9. That is below the failure threshold of 2.0 - collectd-network plugin receives this notification and sends it over to the local syslog server
- the local syslog server forwards the flat message to a remote destination
- the remote syslog-ng server receives the message and parses it using patterndb
- the patterndb extracts relevant values and creates a hash table (name-value pairs):
- program:
collectd - host:
foo - tags:
syslog,collectd - collectd.plugin:
df - collectd.plugin_instance:
tmp - collectd.type:
percent_bytes - collectd.type_instance:
free - collectd.thresh_type: the thresh type (
above/below) - collectd.thresh_value: the failure thresh:
2 - collectd.metric: the value of the current reading:
1.9
This structured event is then routed to syslog-ng destinations, in our case riemann and elasticsearch. Both of these applications can then be used to query the event in a comprehensive manner, for example, “show me all collectd notifications concerning the plugin df and the instance tmp“
Configuration
Due to formatting issues, and for detailed examples on configuring the components of this solution, see the folowing link.
Conclusion
In this article we showed how to send collectd threshold notification messages to a central syslog-ng server, and how to extract numeric metric information from it. We also showed how to route the result to two backends, one of which can be used to view the data in real-time (riemann), and the other to query historical data (elasticsearch). This system could be extended in multiple ways, for instance:
- by compiling a large patterndb to match multiple subsystem messages
- by tagging important messages, and routing them to relevant destinations. For instance: “send all hardware errors to nagios“
- by using the correlation context information to generate alerts, excluding self-healing components: “send an email if a filesystem is full and doesn’t come back to normal in less than 5 minutes”
- by using the correlation context information to generate alerts upon reaching a threshold on the number of messages: “run this command if the same scsi device is referenced in more than 100 messages every minute”
- send metric data to graphite
Configuration files
Here‘s a transcript from a shell session working on these configuration files.
Link to full article including configuration on github
