DevOps.com

  • Latest
    • Articles
    • Features
    • Most Read
    • News
    • News Releases
  • Topics
    • AI
    • Continuous Delivery
    • Continuous Testing
    • Cloud
    • Culture
    • DevSecOps
    • Enterprise DevOps
    • Leadership Suite
    • DevOps Practice
    • ROELBOB
    • DevOps Toolbox
    • IT as Code
  • Videos/Podcasts
    • DevOps Chats
    • DevOps Unbound
  • Webinars
    • Upcoming
    • On-Demand Webinars
  • Library
  • Events
    • Upcoming Events
    • On-Demand Events
  • Sponsored Communities
    • AWS Community Hub
    • CloudBees
    • IT as Code
    • Rocket on DevOps.com
    • Traceable on DevOps.com
    • Quali on DevOps.com
  • Related Sites
    • Techstrong Group
    • Container Journal
    • Security Boulevard
    • Techstrong Research
    • DevOps Chat
    • DevOps Dozen
    • DevOps TV
    • Digital Anarchist
  • Media Kit
  • About
  • AI
  • Cloud
  • Continuous Delivery
  • Continuous Testing
  • DevSecOps
  • Leadership Suite
  • Practices
  • ROELBOB
  • Low-Code/No-Code
  • IT as Code
  • More
    • Application Performance Management/Monitoring
    • Culture
    • Enterprise DevOps

Home » Blogs » LightStep Unfurls Dynamic Tracing Service

LightStep Unfurls Dynamic Tracing Service

LightStep Unfurls Dynamic Tracing Service

By: Mike Vizard on March 12, 2019 Leave a Comment

LightStep announced a stand-alone dynamic tracing tools capability that visualizes patterns in code based on 100 percent of the data available.

Recent Posts By Mike Vizard
  • Hasura SDK Integrates GraphQL Platform With More Data Sources
  • Dynatrace Adds Synthetic Tests to Validate App Experiences
  • ServiceNow Adds Lightstep Notebooks to Visualize Observability Data
More from Mike Vizard
Related Posts
  • LightStep Unfurls Dynamic Tracing Service
  • LightStep Unveils APM for Microservices
  • Splunk Adds Omnition to DevOps Portfolio
    Related Categories
  • Blogs
  • DevOps Practice
  • DevOps Toolbox
    Related Topics
  • Distributed Tracing
  • LightStep Tracing
  • OpenTracing API
  • tracing
Show more
Show less

Company CEO, Ben Sigelman, said LightStep Tracing differs from other approaches to tracing because it does not rely on a small sample of data that usually doesn’t wind up providing much actionable insight. Instead, LightStep Tracing makes it possible to search and visualize distributed traces across 100 percent of the data made available with a software-as-a-service (SaaS) application.

DevOps Connect:DevSecOps @ RSAC 2022

Unveiled at the QCon London 2019 conference, LightStep Tracing is based on functionality originally developed in the application performance management (APM) platform, dubbed LightStep [x]PM, that is optimized for microservices-based applications. LightStep Tracing, however, does not require DevOps teams to implement LightStep [x]PM to take advantage of distributed tracing.

Distributed tracing is becoming more widely employed because that capability makes it much simpler to visualize patterns indicative of a potential performance issues. Sigelman built one of the first instances of distributed tracing during his tenure at Google. Known as Dapper, the project now analyzes more than two billion transactions per second. Sigelman subsequently co-created the OpenTracing Application Programming Interface (API) standard that is now made available under the auspices of the Cloud Native Computing Foundation (CNCF).

According to Sigelman, one of the most common mistakes many DevOps teams make today is overvaluing a distributed trace as a data source. While access to distributed traces are required, the real value comes from being able to dynamically inspect 100 percent of all the traces available in a way that visually surfaces patterns, added Sigelman. DevOps teams should be careful what conclusions they draw from analysis based on samples of data because outliers that could have a significant impact on application performance can be easily missed, cautioned Sigelman.

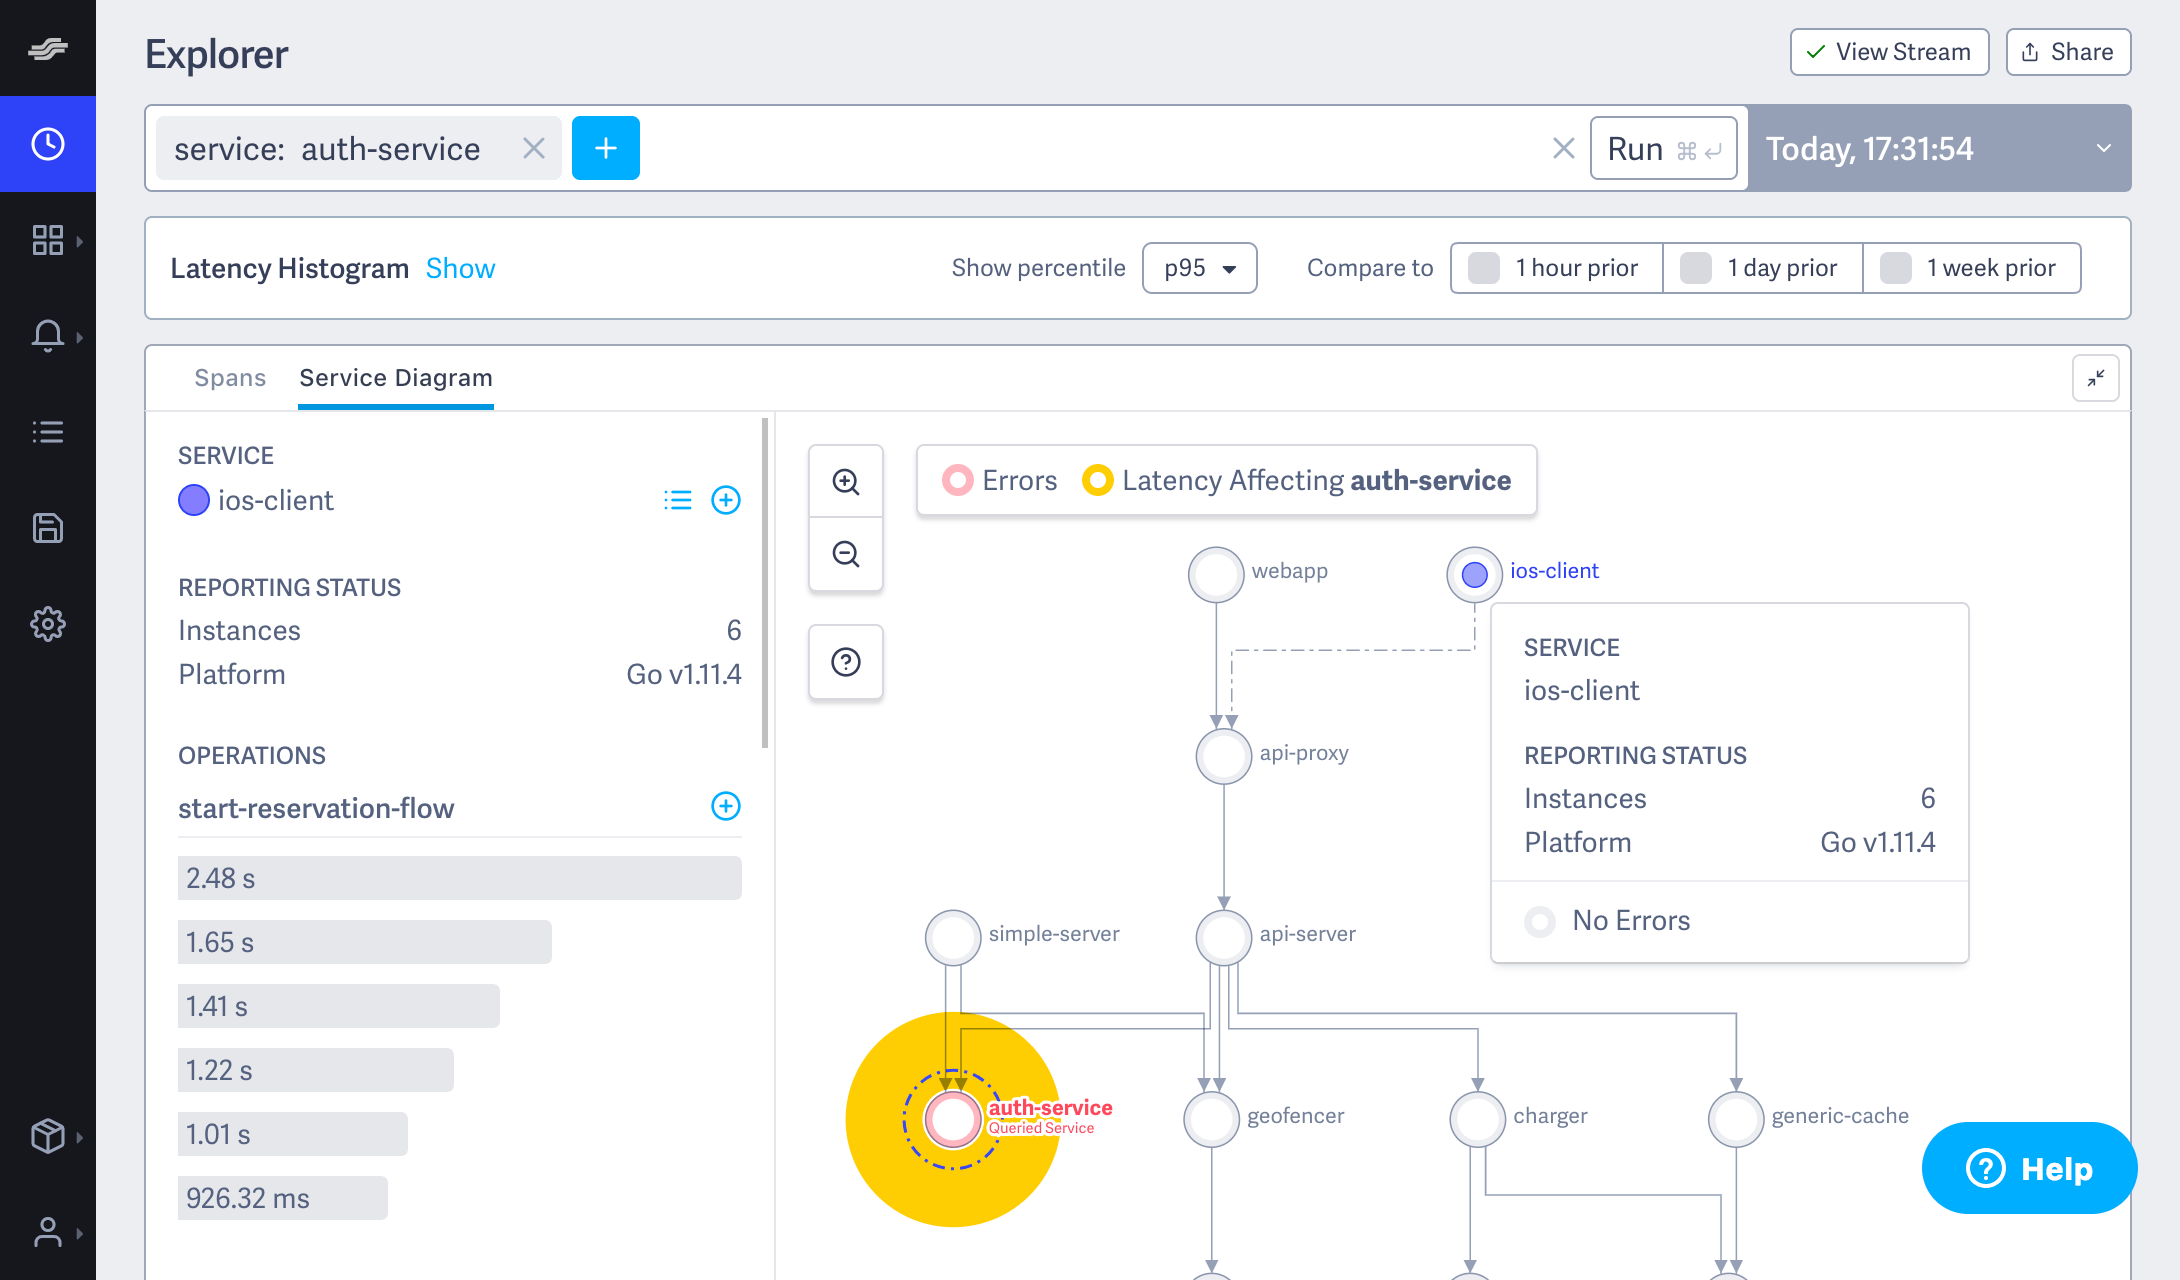
LightStep Tracing provides DevOps teams with access to dynamic system diagrams that visually summarize the bottlenecks, as well as real-time performance histograms enable organizations to understand what defines normal application behavior in their environment. Sigelman said that DevOps teams, for the first time, can also capture shareable snapshots of system behavior that explain performance anomalies based on statistical summaries of thousands of relevant traces. Within minutes, Sigelman said LightStep Tracing can be employed to instrument and visualize service-to-service interactions across web, mobile, microservices, serverless and monolithic applications.

One of the more frustrating aspects of DevOps is that most teams will spend far more time looking for the source of the problem, versus fixing it. But until the source of a problem can be identified, the reputation of the IT organization in the eyes of the application owner continues to suffer. There’s also an unfortunate tendency for DevOps teams to spend an inordinate amount of time in “war rooms” trying to proof that whatever element of the IT environment they manage is not part of the root cause of the problem. Rather than wasting all that time at the expense of the reputation of the IT organization, perhaps the time has come to discover and visualize issues hopefully long before any application owner even becomes aware they exist.

— Mike Vizard

Filed Under: Blogs, DevOps Practice, DevOps Toolbox Tagged With: Distributed Tracing, LightStep Tracing, OpenTracing API, tracing

Sponsored Content
Featured eBook
Hybrid Cloud Security 101

Hybrid Cloud Security 101

No matter where you are in your hybrid cloud journey, security is a big concern. Hybrid cloud security vulnerabilities typically take the form of loss of resource oversight and control, including unsanctioned public cloud use, lack of visibility into resources, inadequate change control, poor configuration management, and ineffective access controls ... Read More
« In Service Management, AI Is Still Aspirational
IT Revolution Announces Second Round of Speakers for DevOps Enterprise Summit London 2019 »

TechStrong TV – Live

Click full-screen to enable volume control
Watch latest episodes and shows

Upcoming Webinars

Deploying Microservices With Pulumi & AWS Lambda
Tuesday, June 28, 2022 - 3:00 pm EDT
Boost Your Java/JavaScript Skills With a Multi-Experience Platform
Wednesday, June 29, 2022 - 3:30 pm EDT
Closing the Gap: Reducing Enterprise AppSec Risks Without Disrupting Deadlines
Thursday, June 30, 2022 - 11:00 am EDT

Latest from DevOps.com

Chip-to-Cloud IoT: A Step Toward Web3
June 28, 2022 | Nahla Davies
DevOps Connect: DevSecOps — Building a Modern Cybersecurity Practice
June 27, 2022 | Veronica Haggar
What Is User Acceptance Testing and Why Is it so Important?
June 27, 2022 | Ron Stefanski
Developer’s Guide to Web Application Security
June 24, 2022 | Anas Baig
Cloudflare Outage Outrage | Yet More FAA 5G Stupidity
June 23, 2022 | Richi Jennings

Get The Top Stories of the Week

  • View DevOps.com Privacy Policy
  • This field is for validation purposes and should be left unchanged.

Download Free eBook

DevOps: Mastering the Human Element

Most Read on DevOps.com

Four Steps to Avoiding a Cloud Cost Incident
June 22, 2022 | Asim Razzaq
The Age of Software Supply Chain Disruption
June 23, 2022 | Bill Doerrfeld
At Some Point, We’ve Shifted Too Far Left
June 22, 2022 | Don Macvittie
Cloudflare Outage Outrage | Yet More FAA 5G Stupidity
June 23, 2022 | Richi Jennings
Developer’s Guide to Web Application Security
June 24, 2022 | Anas Baig

On-Demand Webinars

DevOps.com Webinar ReplaysDevOps.com Webinar Replays
  • Home
  • About DevOps.com
  • Meet our Authors
  • Write for DevOps.com
  • Media Kit
  • Sponsor Info
  • Copyright
  • TOS
  • Privacy Policy

Powered by Techstrong Group, Inc.

© 2022 ·Techstrong Group, Inc.All rights reserved.