As many of us embrace DevOps, developers have to think beyond delivering code that is taken by “operations” to be deployed, run and monitored in production environments. DevOps instead focuses on breaking down silos within organizations and sharing the responsibility of development and operations such that developers are now more conscious of how their code will run in a production environment. They also play a critical role in the process of deploying, monitoring and operating the applications they write.
Thus the responsibilities of developers can now span from development and testing, to deployment and monitoring, to gathering business metrics from production environments – i.e. they now follow a DevOps lifecycle rather than a development lifecycle. The focus of these responsibilities can change slightly depending on which stage an application is at in its maturity model. In this post, we first outline three high-level stages of an application’s maturity and then look at how logs can serve as a valuable tool at each of the different stages and in particular for teams following a DevOps methodology.
The Stages of Application Maturity:
- Stage 1 – Initial system development and prototyping: When organizations embark on new projects, they usually have a small team iteratively develop an initial prototype before throwing the weight of a large development team behind it..This prototype is used to test any hypothesis and initial functionality; it limits risk and allows for an iterative feedback loop from early users. More and more often, prototypes are being quickly developed on cloud infrastructures where the initial development team plays the role of developing the system, selecting and managing the infrastructure, deploying the application, as well as putting in place initial monitoring for the running system. Only after an initial user group has used the system, provided feedback and helped prove a hypothesis will the system will move into a “go-live” state in the real world.
- Stage 2 – System going live: When an application moves from being a prototype to “going live,” an organization has made the decision that the project is worth pursuing and there is potential value in extending the system to a wider audience. This can involve investing in a larger development team, a larger infrastructure to handle real-user load, as well as marketing budgets to get the word out on this new offering. At this stage, focus can shift from initial concepts to building out more advanced and robust capabilities – ensuring service uptime, performance and reliability.
- Stage 3 – System generating value: If a system moves into a stage of creating value for the business, a number of new stakeholders can arrive on the scene with new requirements. Typically product managers and marketing teams will have requirements on how a new application’s features are being used, how an application’s marketing campaigns are tracking and how cohorts of users are flowing through the sales funnel. These new stakeholders are largely concerned with different business metrics and how they can be obtained from the running system.
So where and why log data?
While log data has traditionally been used by developers for debugging purposes (i.e. investigating exceptions stack traces), more recently log data is being applied for a much wider set of use cases. A recent survey carried out across a sample of 25,000 log management users shows a breakdown of the following use cases:
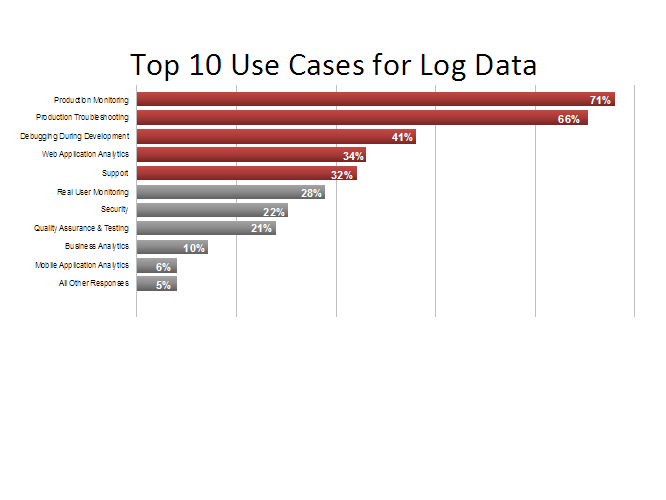
Results from a recent survey from a sample set across 25k users who were asked: “What are the top use cases for your logs?”
As applications move across the different stages of maturity above, logs act as a valuable tool to assist with the insights required by the different stages of the DevOps lifecycle – e.g., during development activities, testing, production monitoring, and web and business analytics. In fact, logs provide a single data stream that can act as a common language across these different tasks.
Because of this shift, it is important to look at how logs can be applied to assist with DevOps-related responsibilities during the different stages of application maturity:
How logs are applied during application maturity stage 1
The ability to apply agile development and testing are key during this phase such that early prototypes are iterated upon and hypothesis proved out:
Logs as a debugging tool: Logs have always been a valuable debugging tool and continue to be so. They can capture events at different severity levels from every layer of the software stack (operating systems, web servers, databases, your software) and from across all devices (mobile devices, servers, routers, firewalls). During development, verbose logging can be enabled to give incredibly detailed information on the system as it executes. Today’s log management technologies are particularly useful as they allow you to utilize the benefits of verbose logging to easily cut through the noise and identify key events when exceptions occur. They also all allow for fast searching of key events in an extremely large volume of log data.
Logs for system load and performance testing: Before a system goes live, system load and performance testing is often performed to give a level of confidence that real-world loads can be handled by the application. Load testing tools will often measure system response times to make sure that the system is performing well even under heavy loads. However, log data should also be analyzed during such tests to make sure high levels of exceptions are not being thrown and that the system is behaving “under the hood” as expected.
How logs are applied during application maturity stage 2
Production monitoring and troubleshooting can be a key focus during this stage of a system’s maturity given that any downtime can be particularly costly from a monetary and reputational perspective once a system goes live.
Log for production monitoring: Production monitoring is fast becoming a leading use case for log data. Real-time processing capabilities of log management solutions now mean that log events can be parsed in real time, and important metrics can be extracted and visualized in high-level monitoring dashboards. Furthermore, real-time alerting can be applied to give notifications when important system events occur or particular thresholds are breached.
Logs for production troubleshooting: Logs no longer simply contain exceptions and stack traces but are instead a blend of information from a range of different sources that can be correlated to allow for quick troubleshooting. This is especially important when there are issues in production. For example, logs will regularly now contain: server resource usage information, application performance metrics, feature usage information, exceptions and errors. This blend of information, which was traditionally only available by utilizing a number of other tools, is now available in a single location via a standard log management solution.
How logs are applied during application maturity stage 3
When an application begins to create value, product and marketing stakeholders will want to focus on usage and business metrics. While this information may go beyond the typical DevOps lifecycle, it is becoming more and more common for developers following a DevOps methodology to be tasked with gathering such information.
Logs for web analytics: Analyzing website trends is not something typically associated with someone in a DevOps role and is usually the mainstay of marketing folks. However, developers are often engaged to collect this data for different parts of the organization. Logs provide a lightweight way to understand who is accessing an application, how often and from where. For starters, a lot of this information is already contained in web server logs without any additional instrumentation required. Furthermore, logs can give not only an aggregate view of web trends, but also allow the drill down to a per-user view to analyze behaviors at an individual user or account level.
Logs for business metrics: Today’s log management technologies allow you to extract field-level values and can aggregate them and roll them up into high-level metrics dashboards. Thus,,logs can be used to not only understand a systems performance and usage trends, but also to aggregate business metrics such as signups per day, number of transactions, the value of those transactions, etc. However, the real benefit of using logs for metrics dashboards, in my opinion, is that they maintain the evidence. In other words, they allow you to easily validate any trends or changes in your system or business’ behavior. This has traditionally been a painful task, as it often involves engineering cycles/checking database tables, etc. Now, logs allow you to immediately drill down from a high-level view to the log-level to quickly view and understand the individual events that may have led to a spike in a key performance indicator.
After spending many years talking to thousands of log management users, I am continuing to see logs become more and more critical to the different stages of an application’s maturity. The DevOps movement has greatly assisted with this because the same team or individual responsible for initial prototype development may also be responsible for production monitoring or gathering business metrics for that matter. The value of logs is now being recognized early in the DevOps lifecycle, and the power of log data is quickly expanding across a range of different functions.
This article is by Trevor Parsons, PhD, Co-founder and Chief Scientist, Logentries
