DevOps has grown in popularity among many companies seeking greater agility and higher-quality code. When using different tools for automation, these organizations need monitoring and tracking of these tools and metrics from different portals on a common dashboard. Toolchain monitoring helps to bring all reports into a common portal.
Enabling monitoring tools from a centralized platform can save a lot of effort and time. These tools have many in-build capabilities that bring value to the business, such as predictive alarming, graphical representation of data and integration with other tools including email, ticketing system and auto remediation. These added features become game-changers in today’s competitive SLA-driven and standard environments.
Monitoring can be categorized in three ways:
- Infrastructure monitoring: Monitoring the environment, machine and resources used to create a platform for an application.
- Application monitoring: Monitoring the application’s performance, resource consumption, processing time and responsiveness.
- DevOps monitoring: Monitoring the pipeline and toolchain from continuous exploration through release management. DevOps monitoring tools have the capability to monitor job health, job status, performance and quality.
Why DevOps Monitoring is Essential
In DevOps, we use many tools to create a toolchain and pipelines. In some big teams with a long release train, monitoring a project’s status from requirements-gathering to deployment can be difficult, as you have to track a number of different tools. And even then, you might not get the status in a desired format. DevOps monitoring tools bring everything to one single dashboard, where you can see the status and other metrics, including useful information about the project quality and progress.
DevOps Monitoring: Not the Same as Tools Monitoring
Tools monitoring is specific to the health and performance of tools; DevOps monitoring focuses on things such as the status of sprint, code quality, code branch status, test results and deployment status. All of which are required by project management for continuous improvement in productivity and quality.
What to Monitor?
There are a number of things we want to monitor in DevOps orchestration, and all these metrics provide a perspective of the current status of the project or product development and productivity:
- Performance: Performance of the application.
- Development (sprint or Kanban progress) and defects status from the application lifecycle management (ALM) tool.
- Code repository monitoring for a project specific branch.
- Build job or pipeline monitoring from the continuous integration (CI) tool.
- Code analysis and security test results and reports.
- Deployment and upgrade status in different environments.
- DevOps maturity using the tools’ usage and quality data.
- Artifacts (versioned artifacts).
These are the basic and mandatory areas any project would monitor on a single dashboard.
Monitoring Use Case
In agile projects, CI/CD tools are implemented following the best practices of DevOps. An ALM tool is implemented to manage the backlog and development sprints. On this project a CI tool is used to build code and all the code is getting committed in a code repo, using a code review and analysis tool. A binary repository has been implemented to store all the binary of every version. An automated deployment tool is being used to deploy the application in QA, staging and production environment.
Now the struggle comes when monitoring each tool, the status of the build and the progress on different portals (CI tool, code repo, analysis tool, deployment tool, etc.).
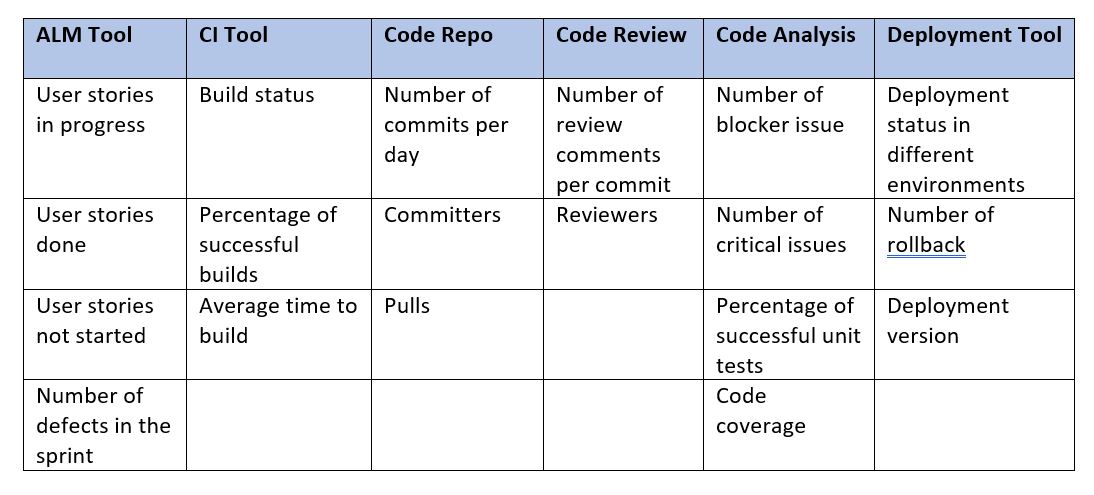
Using centralized monitoring tools can help project management to monitor the metrics mentioned below. These metrics give the overall picture of build, quality and deployment status on one dashboard.

Available Tools for DevOps Monitoring
Below are few available products that provide similar solutions:
- Hygieia: Freeware tool that supports all DevOps tools, but metrics are very limited.
- KlipFolio: Has lots of tool support, but it’s not free.
- DevOps Insights: An IBM tool that supports IBM cloud platform only.
- DataDog: Has a wide range of tool support, but it’s not free.
- Prometheus: Freeware tool that monitors lots of tool-using exporters.
Build vs. Buy
Deciding which tool to use is always a tough task—you need to compare all the available tools and their offerings from different perspectives. Below are a few factors that play an important role when deciding on available options or to build your own solution:
- Range of supported tools (plugins or data collectors).
- Freeware or paid.
- Support to customize data collection.
- Rich UI for data representation and customization of fields and views.
- Range of metrics supported.
- Ease of installation and configuration.
- Licensing and distribution policy.
Solution Approach for Building Your DevOps Monitoring
If you have decided to build or extend any existing tool, below are some considerations:
- Identify the tools you have to monitor: List the DevOps tools you have to monitor; the list should cover all the areas of DevOps (build, repo, code quality, deployment, monitoring, etc.) to get the complete picture.
- Identify the metrics: Once you have the list of tools, identify the important metrics from each tool. Your metrics should be capable of providing KPIs of DevOps areas.
- Identify API or command-line interface to fetch the metric data: You need a good understanding of tools and their implementation to identify the best way to fetch the data. It could be predefined APIs, REST APIs or any command line interface. Make sure you are getting all the desired data.
- Correlate the metrics with the business value or define the DevOps KPI: Your metrics should represent the KPIs and business value of all the tools involved in achieving DevOps. The dashboard should cover all the aspects and represent the current status and gaps.
- Determine how to store and process those metrics: You need to define the schema to store the data in defined database; your schema should be generic enough to cater any data from different tools. To process the data, you need a middleware component between database and UI to process in a presentable format.
- Build a scoreboard based on metrics: Use a rich GUI to display the scoreboard in different formats such as table, graphs and charts.
- Support high availability: The tool should be designed to support high availability to avoid downtime and loss of data points.
How Monitoring Tools Collect Data
Most of the tools we use for implementing DevOps and CI/CD are web-based tools such as Jenkins, Sonar, Git, SVN, UDeploy, Gerrit, Jira, Confluence or others. These tools provide REST APIs, from which we get the data in a described format—either in json or xml. Some tools support predefined APIs or CLIs to connect and fetch the data. Once you identify the communication mechanism with the end system, the next step will be writing robust code that can fetch the desired metrics data and handle all the cases to parse the data and put it in a relational or non-relational database.
Once you have the data in the database, you need a GUI to display those in tabular and graphical formats and a middleware component that can fetch the data from the database and provide it to GUI in the desired format.
Getting the data from the system you want to monitor is the real challenge in this whole exercise, as everything else depends on it. Below are a few challenges you might face while developing a toolchain monitoring system:
- Identify the API or any other mechanism to fetch the data.
- Identify the metrics to monitor.
- Identify how you want the data to be presented on the GUI—whether a trend chart, pie chart or just tabular presentation.
- Determine the authentication mechanism for the monitoring system, as each supports a different kind. Sometimes it needs a predefined token while other times a token needs to be generated at runtime.
Simple Architecture of DevOps Pipeline Monitoring
Below is the simple generic architecture, on which most of the monitoring tools work. In the picture below, the different DevOps tools are on the left side; these tools are the end system from where we want to bring the data. Only a few tools have been shown as an example.

A data collector brings the data from each end system and communicates with the end system using a REST API or any API exposed by that tool or a CLI, depending on the case. Using the defined communication mechanism, it will bring the data and pass it to the parser to fetch the required data and put it in the database in the desired format.
While developing data collection, you need to have good a understanding of the tool you are going to monitor as well as available APIs including REST, CLI, SMIs or any pre-defined API built within the tool.
The data parsing layer will fetch the desired metric value from the raw data collected by the data collector. Raw data could be in any format, including key value pair, json, xml or csv. The parsing methodology will differ in each case depending on the type of data. You can use any generic API for the parsing available.
You must identify a good API to parse the data available in a different format and complexity.
The database will hold the metrics data of each interval for each tool and user credentials.
The GUI will request the data from the parsing component. It will represent it in tabular or graphical user-friendly format.
Other features: Once we have data, we can have the trend chart to make some critical decisions, we can generate alarm on breaching any defined thresholds and integrate it with email or SMS to take immediate action.
Monitoring Tool High Availability
If we are relying on our monitoring tool to get reports of all the tools used in DevOps, we cannot afford downtime. We may lose data points and trends if the monitoring tool goes down, and management may not get the actual status of an entire project without having to gather the data manually.
To avoid such situation, high availability (HA) should be implemented on the monitoring tool. In case of a HA setup, we will keep gathering the data in case the monitoring node goes down.
To implement the HA, there are two aspects we need to consider: the HA of GUI and middleware (business logic component) and the HA of database.
HA in the GUI and middleware could be achieved using an Apache or Nginix cluster. In the case of containerized environments, we can use any orchestration platform’s default feature to achieve high availability, such as Kubernetes. Similarly, in the database we can implement a clustered database feature provided by the most of available databases.
Conclusion
DevOps toolchain monitoring is very useful. It provides a good snapshot of the health of a project to management and is able to identify any blocker issues that might impact the release so they can be corrected. Monitoring can help identify pain points to focus on in defining the road map. Organizations following DevOps practices and using DevOps tools should have a tool to monitor the DevOps pipeline.


