New Relic this week added an ability to enable DevOps teams to better understand the potential business impact any change to an IT environment might have.
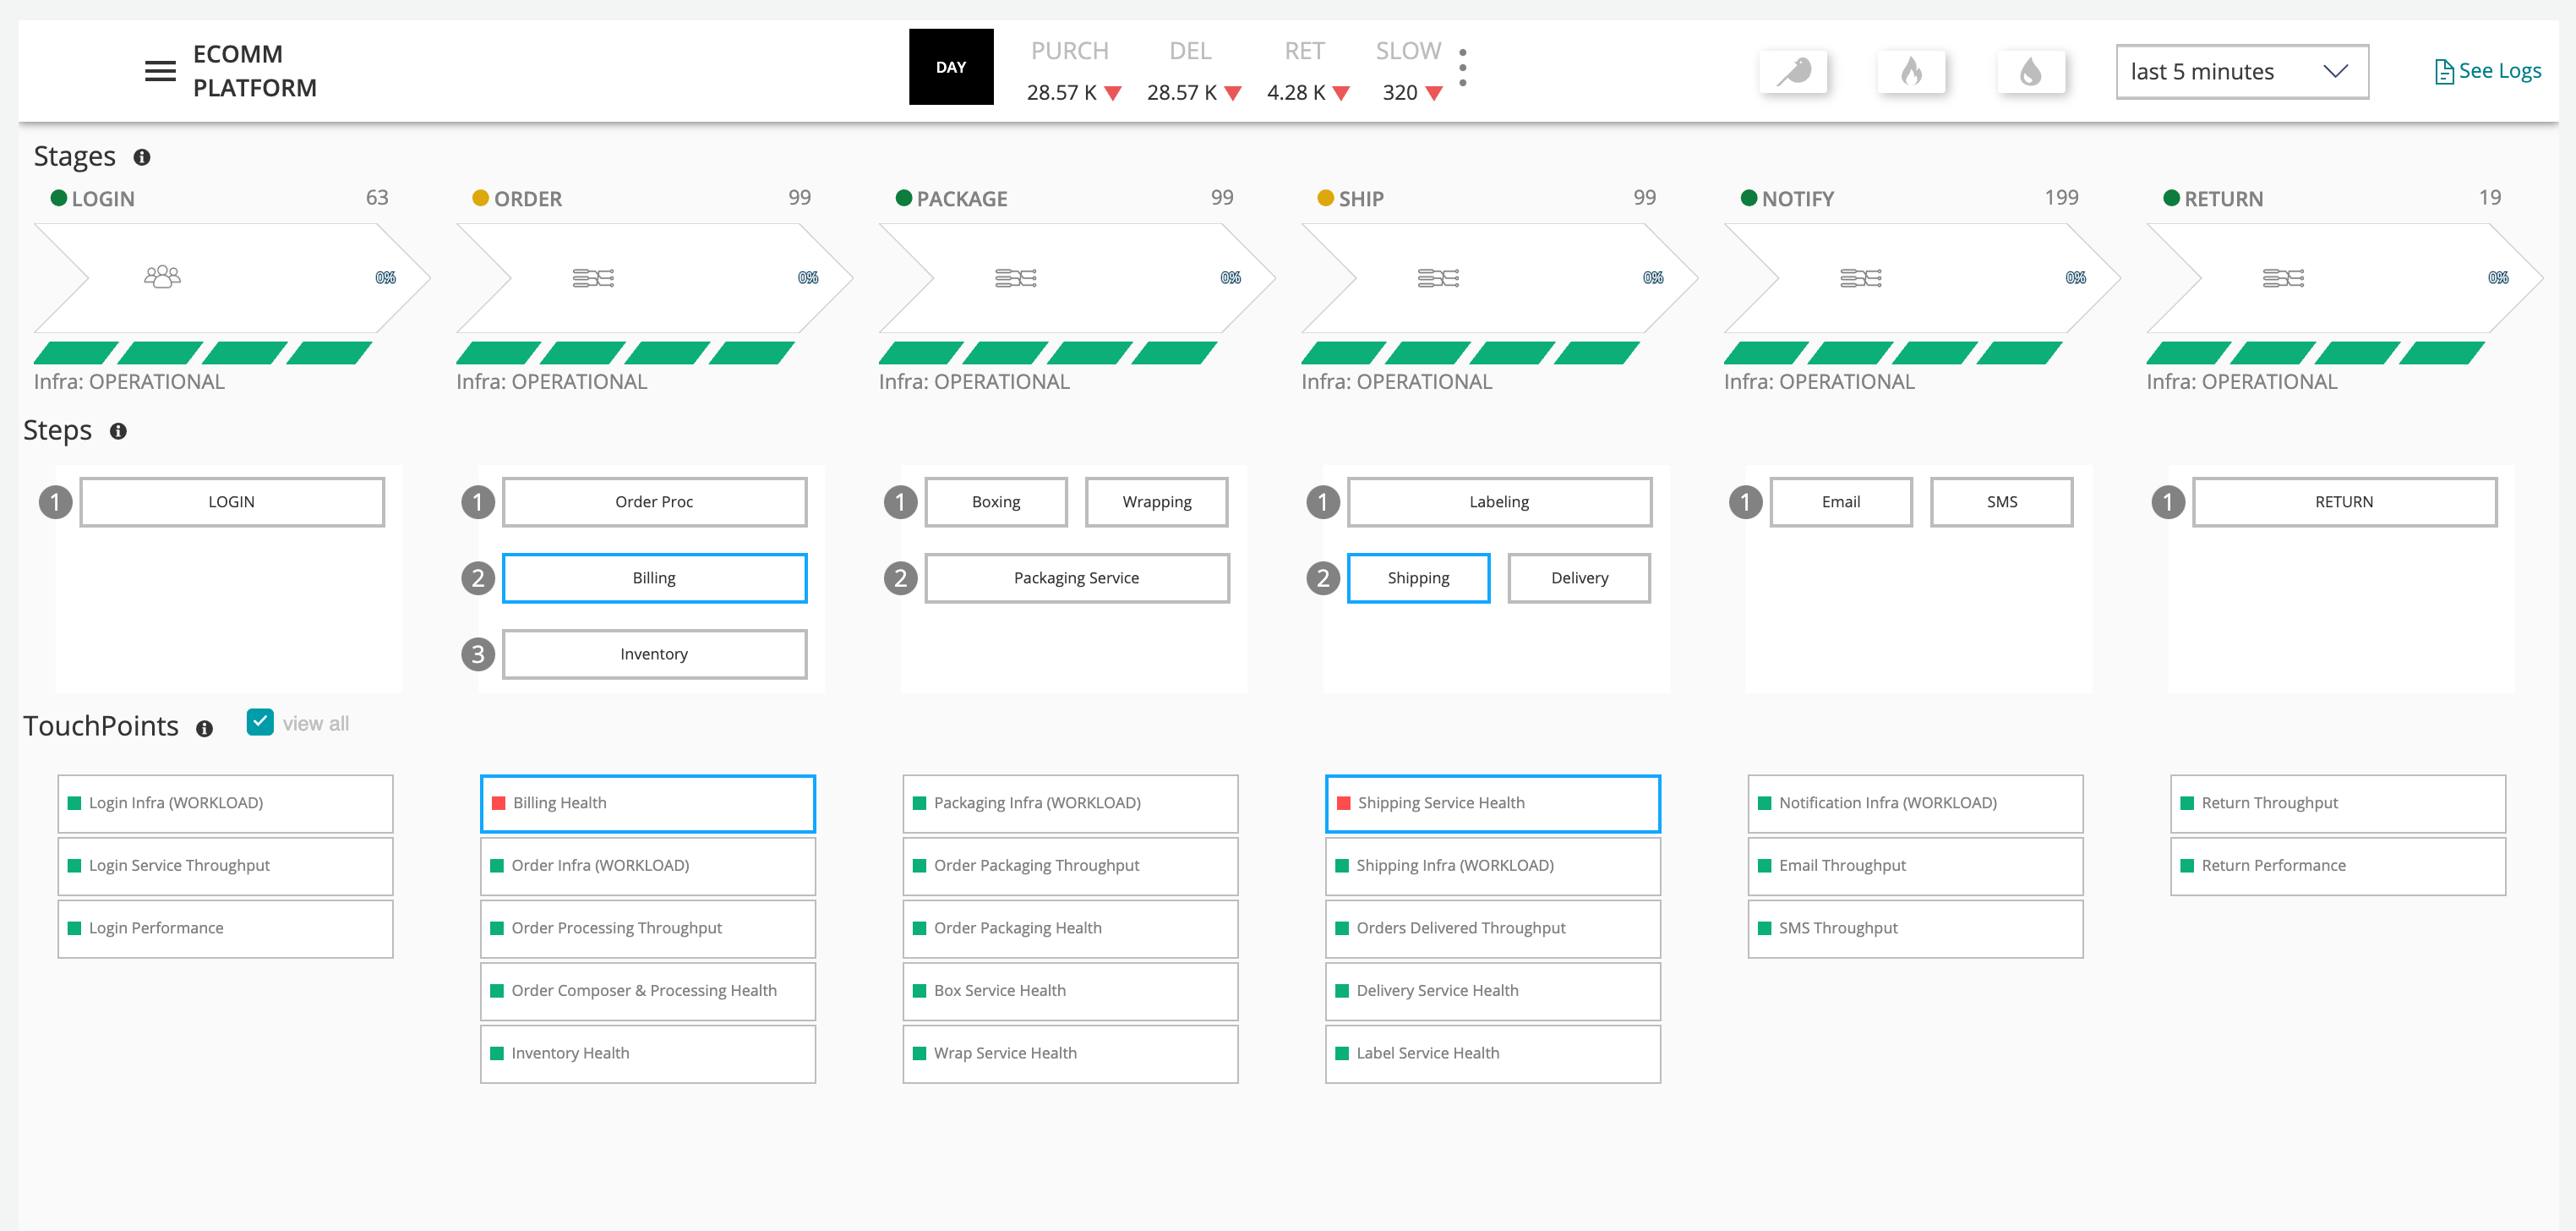
Manav Khurana, chief product officer for New Relic, said New Relic Pathpoint adds a dashboard to the company’s observability platform through which business metrics can be collected alongside telemetry data. That data is collected either via connectors provided by New Relic or via a metrics application programming interface (API) that IT teams can invoke.
IT teams can use that API to connect to custom applications or an end-to-end business process, noted Khurana.
All that data is then modeled alongside DevOps telemetry data to provide insights into the impact any change might have on the business in real-time, he added. That approach provides the added benefit of making it easier to strategically align the management of applications, services and infrastructure by business function, noted Khurana.
In the near future, New Relic will also extend the natural language capabilities it is currently previewing to New Relic Pathpoint, he said.


Longer term, New Relic is working toward making it possible to model how proposed changes to business processes will impact IT environments, added Khurana.
Business and IT leaders intuitively understand that every business event creates a corresponding IT event, but most organizations manage those processes in isolation. New Relic Pathpoint presents an opportunity to close a divide between IT teams and the rest of the business that has plagued organizations for decades.
It may be a while before advances in data analytics and AI eliminate that divide completely, but creating a common set of metrics for managing business and IT processes is a crucial first step.
In the meantime, DevOps teams, in addition to accelerating the pace at which applications can be built and deployed, are being asked to employ observability platforms such as New Relic One to minimize disruption to the business. Observability has always been a core DevOps tenet, but achieving and maintaining it is challenging. Most DevOps teams today aspire to be able to maintain some level of continuous monitoring. However, as it becomes easier and less costly to instrument applications using open source agent software, interest is rising in observability platforms that simplify the investigation of anomalies indicative of an issue that could disrupt an application environment. As that shift occurs, more organizations will seek to correlate IT and business events.
It’s still early days as far as the adoption of observability platforms is concerned, but it’s apparent that as application environments become more complex, the plethora of monitoring tools that DevOps teams rely on will need to be streamlined. It’s not uncommon for DevOps teams to have multiple monitoring tools that surface a set of predefined but often conflicting metrics. Observability platforms, however, unify logs, metrics and traces in a way that makes it simpler to launch queries to identify the root cause of an issue, hopefully before any catastrophic disruption can occur.
