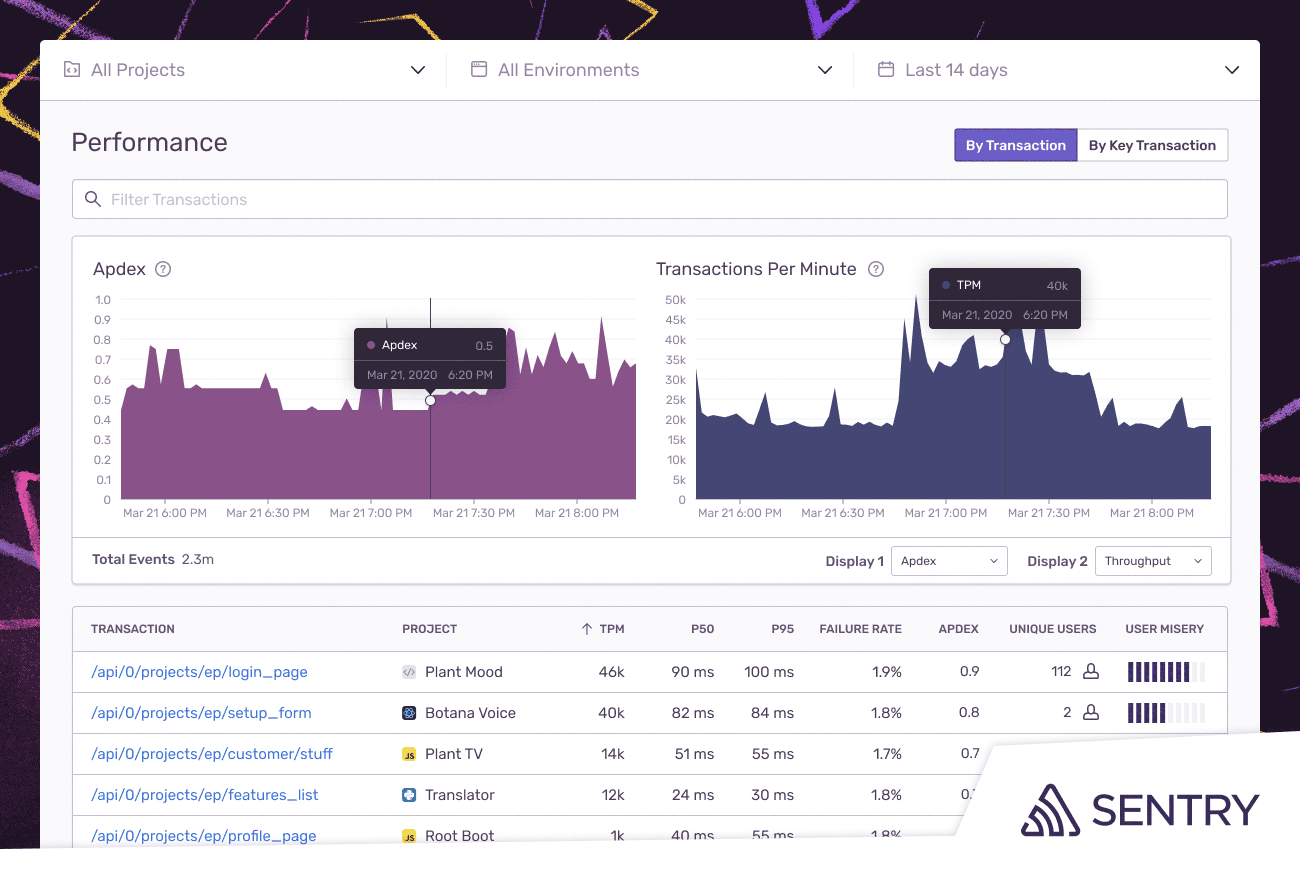
Sentry has extended the reach of its agentless monitoring platform to now track performance issues in addition to surfacing errors in code.
Company CEO Milin Desai said IT organizations can now consolidate the number of monitoring platforms they employ to reduce their overall costs. Previously, the Sentry platform only identified errors in applications. The Sentry platform, he said, now provides a more holistic view of the overall health of JavaScript and Python applications without requiring IT teams to install and manage agent software in every application.
Performance monitoring tools now make it possible to dynamically track application response times based on latency and throughput data. IT teams can analyze slow response times, increases in transactions and error rates to diagnose and fix all performance issues.
IT teams can also set thresholds that generate alerts if performance metrics fall past a predefined tolerance level. IT teams can also drill down into transaction details within tracing waterfalls to visually highlight application programming interface (API) call times that are taking longer than expected.
There is also a Transaction Summary View that sorts transactions based on slowest duration time, related issues and the number of users having a slow experience. IT teams can also track specific critical transactions in addition to gauging how users react to new code pushed to production.
A Root Cause Analysis tool makes it possible to identify and drill down into differences in characteristics between outliers and normal performing transactions.

Finally, a tracing capability makes it possible to identify the exact database query that caused an error or performance issue.
Desai said Sentry requires developers to add only five lines of code to their application. As such, developers can take advantage of Sentry without requiring the help of IT teams to manage agent software. In some cases, however, DevOps teams are standardizing on Sentry because it enables performance and error monitoring to be pushed further left toward developers, who are in the best position to address an issue, he said.
As applications and IT environments become more complex in the age of microservices, there is obviously a greater need for instrumentation. The debate is how best to go about achieving it. Many DevOps teams now find themselves managing a raft of agent software alongside every application that is deployed. Over time, the weight of all that agent software starts to impact DevOps processes.
In the meantime, IT teams continue to spend more time looking for the root cause of an issue once a problem is surfaced than they do actually fixing it. As applications are developed in larger numbers, thanks in part to the rise of DevOps, it becomes more critical to resolve application issues faster. Otherwise, application developers will wind up spending most of their time debugging applications versus writing new code, which obviates the whole reason for investing in DevOps processes in the first place.
Observability, of course, is a core tenet of DevOps for that very reason. The challenge is making sure observability is provided in the least frictionless way possible.


