DevOps.com

  • Latest
    • Articles
    • Features
    • Most Read
    • News
    • News Releases
  • Topics
    • AI
    • Continuous Delivery
    • Continuous Testing
    • Cloud
    • Culture
    • DataOps
    • DevSecOps
    • Enterprise DevOps
    • Leadership Suite
    • DevOps Practice
    • ROELBOB
    • DevOps Toolbox
    • IT as Code
  • Videos/Podcasts
    • Techstrong.tv Podcast
    • Techstrong.tv - Twitch
    • DevOps Unbound
  • Webinars
    • Upcoming
    • On-Demand Webinars
  • Library
  • Events
    • Upcoming Events
    • On-Demand Events
  • Sponsored Content
  • Related Sites
    • Techstrong Group
    • Container Journal
    • Security Boulevard
    • Techstrong Research
    • DevOps Chat
    • DevOps Dozen
    • DevOps TV
    • Techstrong TV
    • Techstrong.tv Podcast
    • Techstrong.tv - Twitch
  • Media Kit
  • About
  • Sponsor
  • AI
  • Cloud
  • Continuous Delivery
  • Continuous Testing
  • DataOps
  • DevSecOps
  • DevOps Onramp
  • Platform Engineering
  • Low-Code/No-Code
  • IT as Code
  • More
    • Application Performance Management/Monitoring
    • Culture
    • Enterprise DevOps
    • ROELBOB
Hot Topics
  • npm is Scam-Spam Cesspool ¦ Google in Microsoft Antitrust Thrust
  • 5 Key Performance Metrics to Track in 2023
  • Debunking Myths About Reliability
  • New Relic Bets on AI to Advance Observability
  • Vega Cloud Commits to Reducing Cloud Costs

Home » Blogs » Application Performance Management/Monitoring » Sentry Extends Application Performance Monitoring Tool

Sentry Extends Application Performance Monitoring Tool

Avatar photoBy: Mike Vizard on December 23, 2020 1 Comment

Sentry this week announced it has added support for applications that employ serverless computing frameworks as well as the Google Web Vitals service to its application monitoring tool.

Recent Posts By Mike Vizard
  • New Relic Bets on AI to Advance Observability
  • Vega Cloud Commits to Reducing Cloud Costs
  • env0 Extends Workflow Platform for Provisioning Infrastructure
Avatar photo More from Mike Vizard
Related Posts
  • Sentry Extends Application Performance Monitoring Tool
  • Sentry Adds Application Performance Monitoring to Platform
  • Catchpoint Announces Native Support for Google’s Core Web Vitals
    Related Categories
  • Application Performance Management/Monitoring
  • Blogs
    Related Topics
  • application performance
  • google
  • observability
  • performance monitoring
Show more
Show less

Company CEO Milin Desai said incorporating Google Web Vitals metrics into Sentry Performance Monitoring will become crucial as Google makes good on a pledge to rank websites and applications on its search engine based on the metrics it collects via this service.

TechStrong Con 2023Sponsorships Available

Google Web Vitals determines how fast an application is by monitoring how fast a site presents user interface objects. By coupling Web Vitals with transaction data gathered by Sentry, it becomes possible for developers to correlate how a transaction may be adversely impacting the user experience. That data then can be employed to adjust what application programming interfaces (APIs) should be called within an application, Desai said.

At the same time, he noted a larger percentage of developers are starting to employ serverless computing frameworks within the front end of their applications. The Sentry platform now monitors serverless computing frameworks that are employed within a PHP, Node and Ruby-based application. Most of those frameworks are being used to trigger a specific action when some type of event occurs within an application, said Desai.

Finally, Sentry has also added a Trends view that enables developers to see the most improved and most regressed transactions that have occurred over time. That capability enables developers to more easily determine when changes to the overall IT environment are adversely impacting their applications. Armed with that data, it then becomes easier to identify what changes were made at that time.

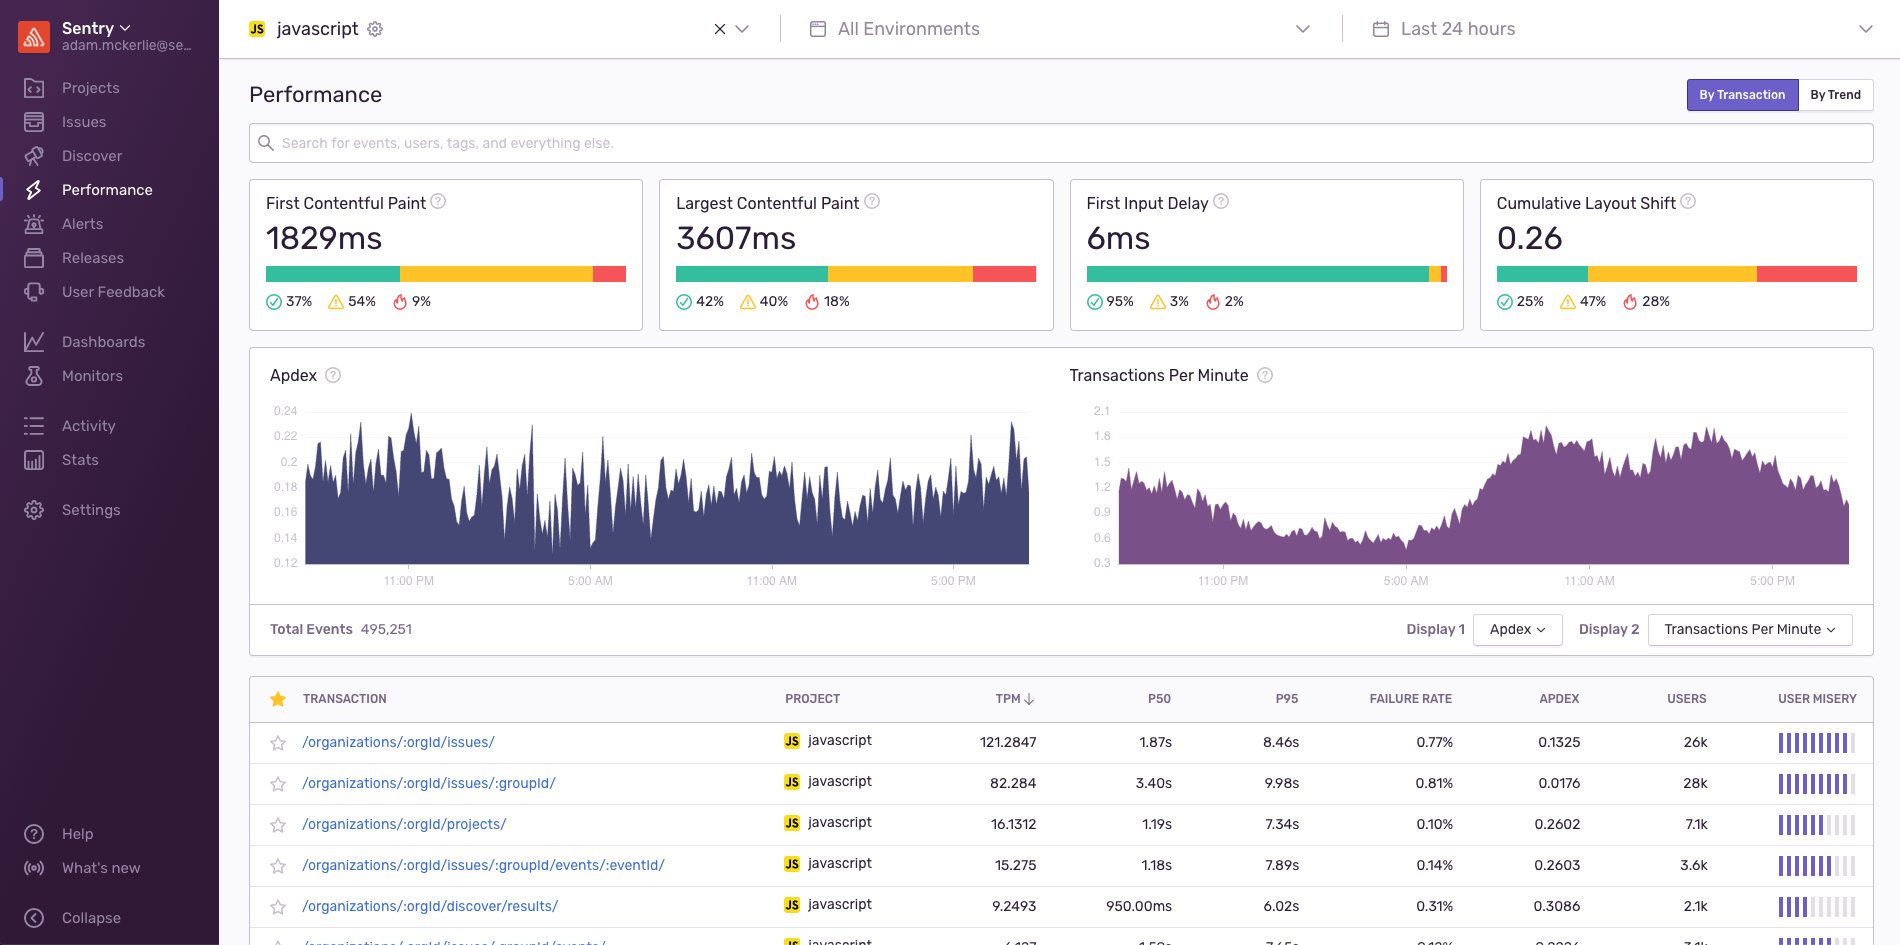
In general, Desai said there is not enough focus on enabling observability for application developers versus IT operations teams. Sentry Performance Monitoring is designed to enable developers to correlate specific events occurring within their code to actual end user experiences by adding five lines of code to their applications.

Observability tools for developers will not obviate the need for observability tools for IT operations teams, but Desai noted as far as visibility into applications is concerned, most developers today are flying blind. Observability is supposed to be a core tenet of any DevOps practice. However, the level of observability actually being achieved tends to vary widely among IT organizations.

Of course, the best place to solve any issue is going to be within the application code, whenever possible. Many developers could eliminate performance issues long before many IT operations teams realize they exist if they had more visibility into how code was executing. That issue will become all the more pressing as IT organizations deploy applications based on microservices that have many dependencies.

The challenge IT organizations face now is determining not only which observability platforms to employ, but also what level of visibility is required for all the different roles and personas that make up that team.

Filed Under: Application Performance Management/Monitoring, Blogs Tagged With: application performance, google, observability, performance monitoring

« 5 Reasons Why DevOps Needs AI
AWS Taps Grafana Labs to Launch Managed Observability Service »

Techstrong TV – Live

Click full-screen to enable volume control
Watch latest episodes and shows

Upcoming Webinars

https://webinars.devops.com/overcoming-business-challenges-with-automation-of-sap-processes
Tuesday, April 4, 2023 - 11:00 am EDT
Key Strategies for a Secure and Productive Hybrid Workforce
Tuesday, April 4, 2023 - 1:00 pm EDT
Using Value Stream Automation Patterns and Analytics to Accelerate DevOps
Thursday, April 6, 2023 - 1:00 pm EDT

Sponsored Content

The Google Cloud DevOps Awards: Apply Now!

January 10, 2023 | Brenna Washington

Codenotary Extends Dynamic SBOM Reach to Serverless Computing Platforms

December 9, 2022 | Mike Vizard

Why a Low-Code Platform Should Have Pro-Code Capabilities

March 24, 2021 | Andrew Manby

AWS Well-Architected Framework Elevates Agility

December 17, 2020 | JT Giri

Practical Approaches to Long-Term Cloud-Native Security

December 5, 2019 | Chris Tozzi

Latest from DevOps.com

npm is Scam-Spam Cesspool ¦ Google in Microsoft Antitrust Thrust
March 31, 2023 | Richi Jennings
5 Key Performance Metrics to Track in 2023
March 31, 2023 | Sarah Guthals
Debunking Myths About Reliability
March 31, 2023 | Kit Merker
New Relic Bets on AI to Advance Observability
March 30, 2023 | Mike Vizard
Vega Cloud Commits to Reducing Cloud Costs
March 30, 2023 | Mike Vizard

TSTV Podcast

On-Demand Webinars

DevOps.com Webinar ReplaysDevOps.com Webinar Replays

GET THE TOP STORIES OF THE WEEK

Most Read on DevOps.com

Don’t Make Big Tech’s Mistakes: Build Leaner IT Teams Instead
March 27, 2023 | Olivier Maes
How to Supercharge Your Engineering Teams
March 27, 2023 | Sean Knapp
Five Great DevOps Job Opportunities
March 27, 2023 | Mike Vizard
The Power of Observability: Performance and Reliability
March 29, 2023 | Javier Antich
Cloud Management Issues Are Coming to a Head
March 29, 2023 | Mike Vizard
  • Home
  • About DevOps.com
  • Meet our Authors
  • Write for DevOps.com
  • Media Kit
  • Sponsor Info
  • Copyright
  • TOS
  • Privacy Policy

Powered by Techstrong Group, Inc.

© 2023 ·Techstrong Group, Inc.All rights reserved.