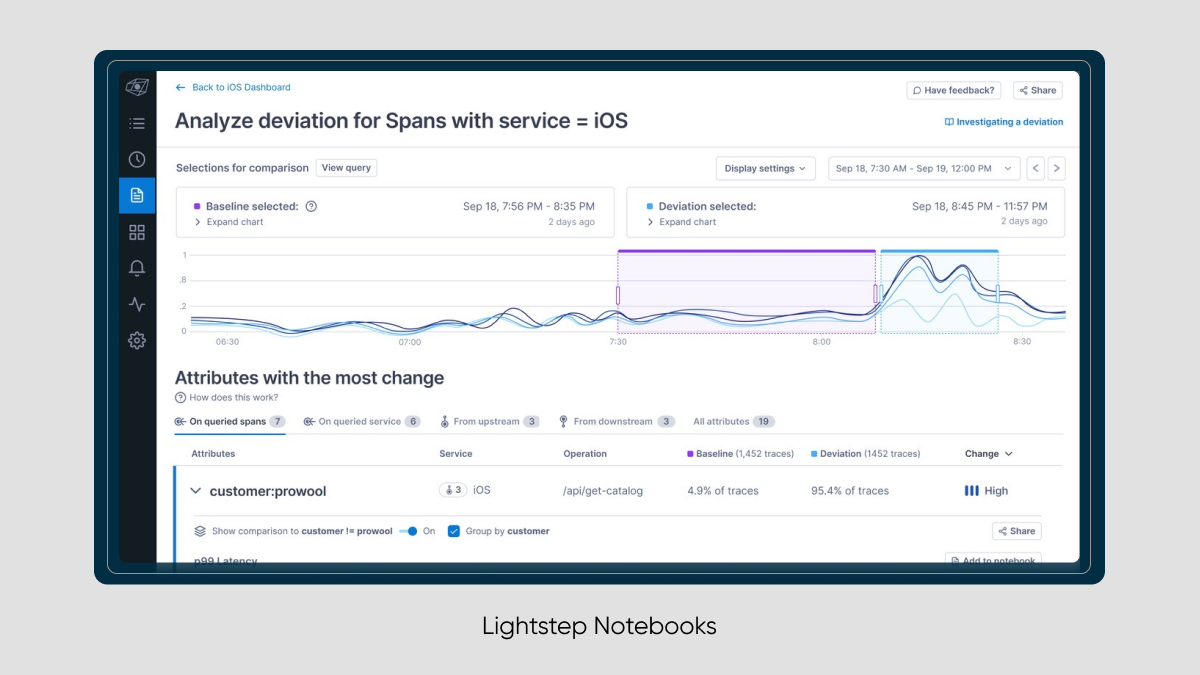
ServiceNow today added a visualization tool to its Lightstep observability platform that will make it simpler for DevOps teams to correlate metrics, logs and traces.
Ben Sigelman, general manager for Lightstep at ServiceNow, said Lightstep Notebooks will make it easier for DevOps teams to make sense of the massive amounts of data collected by the observability platform.
Lightstep Notebooks is an extension of the Change Intelligence analysis engine that ServiceNow already makes available within an observability platform it acquired in 2021.
Included with Lightstep Notebooks are a set of ad hoc charts that include access to heat maps and time-series data with trace exemplars using the database at the core of the Lightstep observability platform.
An instantly generated investigative path also makes it simpler to identify the root cause of any issue, and each instance of Lightstep Notebooks can be shared with other members of the IT organization via an embedded link. Finally, 100% of trace data can be retained for up to three days.

Sigelman said the ability to share Notebooks via embedded links will also help bridge the divide between DevOps and IT service management (ITSM) teams that often need to collaborate to resolve an IT issue.
Naturally, the level of collaboration between those teams tends to vary widely by organization. However, as DevOps best practices are more widely embraced, the number of organizations that are trying to achieve that goal continues to steadily increase. Earlier this year, ServiceNow added an incident response offering to orchestrate on-call escalation, group alerts and provide analytics in further pursuit of that goal.
Observability platforms aggregate the collection of logs, metrics and traces in a way that makes it possible for DevOps teams to query that data. The goal is to make it easier for DevOps teams to both identify the root cause of an IT issue and pinpoint any anomalies that might disrupt an application environment. The goal is to eliminate the need to convene a “war room” meeting that requires IT teams to suffer through the painstaking process of elimination to identify the root cause of an issue.
Of course, before an IT environment can be observed, it needs to be instrumented. Thanks to advances in the form of open source agent software being advanced via the OpenTelemetry project managed under the auspices of the Cloud Native Computing Foundation (CNCF), it’s becoming less costly to instrument IT environments. That’s especially critical at a time when more DevOps teams are deploying microservices-based applications that are more complex to manage than legacy monolithic applications. While generally more resilient, the dependencies that exist between the microservices that make up an application can be difficult to identify without the aid of an observability platform.
As a core DevOps tenet, the need for observability and instrumentation has always been apparent. The challenge has been finding the best way to achieve that at an acceptable cost, Fortunately, there is now no shortage of observability platforms. The only remaining issue is to determine which one best fits within the construct of the organization’s defined DevOps workflow.


