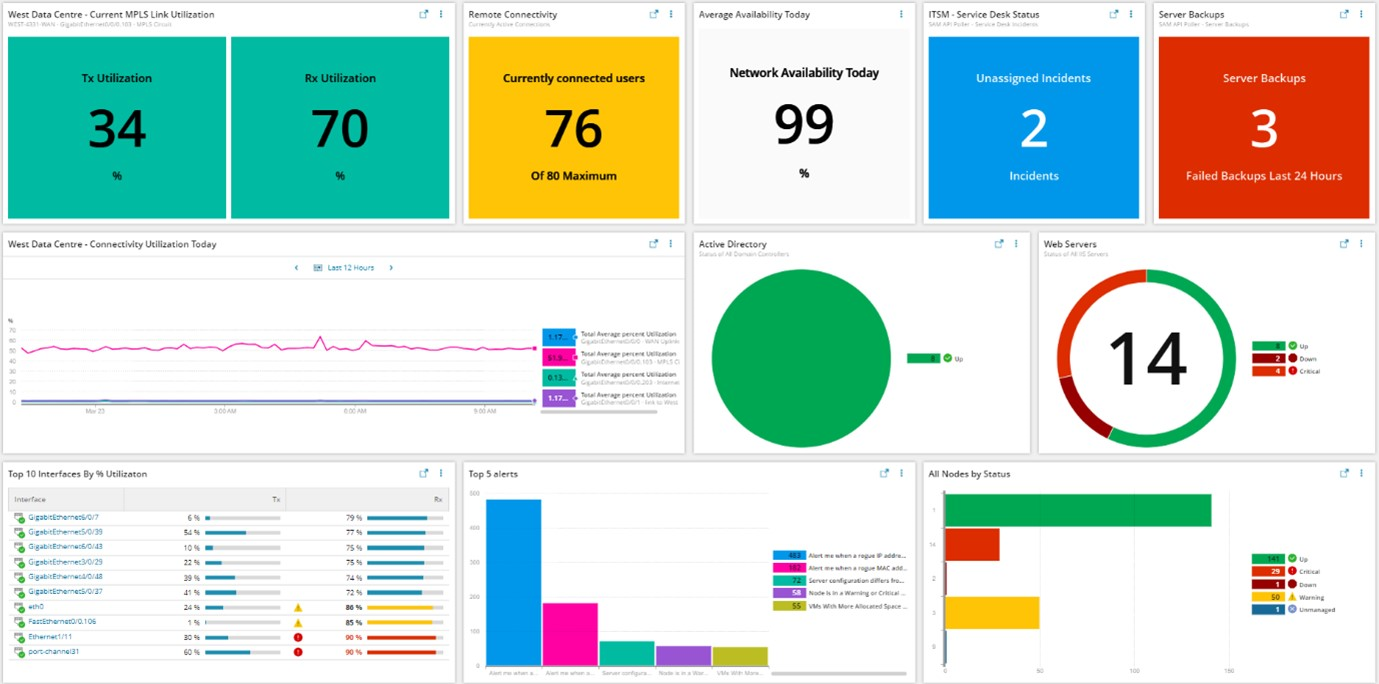
SolarWinds this week launched an observability platform that makes available a range of tools and technologies that the company has developed and acquired via a common user interface.
Rohini Kasturi, chief product officer for SolarWinds, said the SolarWinds Hybrid Cloud Observability platform also makes an observability platform affordable for a much wider range of organizations.
The platform also makes it easier to discover, map, and understand dependencies in ways that make it easier to achieve and maintain service level objectives, he added.
The SolarWinds Hybrid Cloud Observability is a suite of tools made available via multiple tiers that make it simpler to automatically discover the root cause of an IT issue in addition to making it easier to manage configuration, reporting, and planning tasks across cloud computing and on-premises IT environments, said Kasturi.

As IT teams increasingly distinguish between merely monitoring IT environments and achieving observability that allows them to proactively surface anomalies using machine learning algorithms and other forms of data science, the level of depth and insight that can be applied to managing IT is increasing dramatically. In fact, observability is quickly becoming table stakes for any provider of IT management tools, noted Kasturi.
There is, of course, no shortage of observability platforms. The SolarWinds Hybrid Cloud Observability is designed to be deployed alongside existing monitoring tools rather than requiring IT teams to rip and replace the tools they already employ, said Kasturi.
It’s not clear to what degree IT organizations are embracing observability. As a core tenet of best DevOps practices, observability has always been a goal. However, even the most advanced DevOps teams have thus far achieved little more than continuous monitoring of IT environments that are based on a set of pre-defined metrics. An observability platform not only surfaces anomalies but also enables DevOps teams to launch queries across logs, metrics and distributed traces to identify the root cause of a performance issue before it becomes a major disruption.
The biggest challenge, however, may not be the technology as much as it is simply understanding what queries to launch. As IT environments become more complex thanks in part to the rise of microservices-based applications, the number of potential permutations that might impact a highly dynamic IT environment is increasingly beyond the ability of any IT team to manually track. It’s already apparent that many of the legacy monitoring tools that DevOps teams rely on today will need to be rationalized in favor of tools infused with machine learning algorithms capable of discerning patterns across a complex IT environment.
In the meantime, IT teams will need to spend a considerable amount of time experimenting with observability platforms in the months ahead. After all, applications don’t magically instrument themselves. However, once IT teams do find a way to aggregate the logs, metrics and traces that can be collected from one application environment, it does become easier to define a set of best practices that can eventually be more widely applied.


