This article covers important steps to monitor a typical Java application using Stagemonitor tool, Kibana as a dashboard viewing tool and Elasticsearch as a data processing engine.
Stagemonitor is an open source Java application performance monitoring (APM) tool that provides everything you need in development, quality assurance and production to monitor the performance of your Java web application.
Using this tool, we can have different dashboards such as JVM dashboards, application server, request metrics, host, request analysis, web analytics, etc.
Architecture of the Stagemonitor
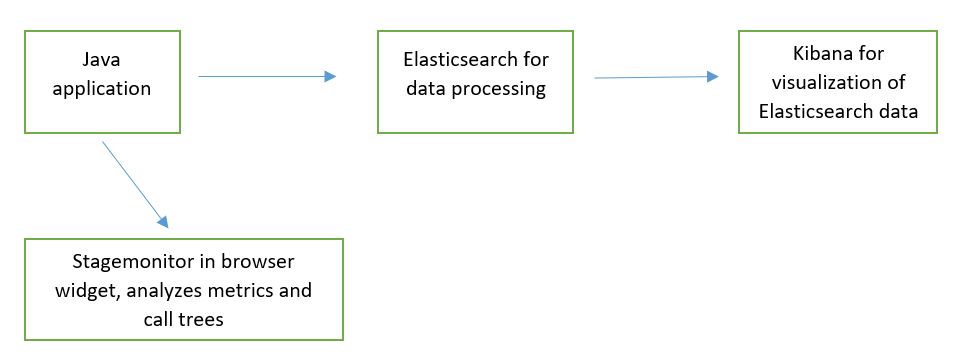
The Stagemonitor agent sits inside the application and sends metrics and details about requests (request traces) to Elasticsearch. Metrics can optionally be sent to Graphite, Influx DB and Prometheus.
Prerequisites
- Minimum of 2GB RAM and 200GB hard disk
- Java version of 1.8 or more
- Install latest versions of Kibana and Elasticsearch
Steps to Monitor Java App with Stagemonitor
Dev Time Monitoring With Browser Widget
This step illustrates how to enable a widget in dev time monitoring, adding the Stagemonitor plugin inside the Java app. We can do this in two ways: We can directly edit the pom.xml/build.gradle file by adding the required stage monitor plugins, or we can add dependencies in the application’s LIB directory.
Some of the important plugins we must have in pom.xml/build.grade to get monitoring dashboards are Stagemonitor configuration, Stagemonitor tracing Elasticsearch, Stagemonitor tracing, Stagemonitor-jdbc, Stagemonitor-jvm, Stagemonitor-os, Stagemonitor-web-servlet and Stagemonitor alerting.
We’ll get the Stagemonitor plugins from the following location: https://mvnrepository.com/search?q=stagemonitor
After installing the agent, will have to create one Stagemonitor configuration file as stagemonitor.properties file under src/main/resources in case of maven application. Otherwise, the file must be located at the root of class path. At the end, it has to be under the WEB-INF/classes section.
The following is what the stagemonitor.properties file looks like:
stagemonitor.applicationName=My Application
stagemonitor.instanceName=dev
stagemonitor.instrument.include=org.example.app
Request Dashboard
In this section, we focus on setting up the time series database to collect the data and visualization tool to view the metrics in detail. Here we’ll use Elasticsearch as the time series database engine and Kibana as the visualization tool.
To get the data from Elasticsearch database, we will include properties in the stagemonitor.properties file:
stagemonitor.reporting.elasticsearch.url=value,
stagemonitor.reporting.elasticsearch.username=value
stagemonitor.reporting.elasticsearch.password=value
stagemonitor.reporting.interval.elasticsearch=60
After adding all the required values and restarting the server, we will be able to open the (automatically added) request analysis dashboard in Kibana. Along with that, we will be able to see different dashboards automatically.
To use Influx DB as a time series database, we’ll have to configure the values in stagemonitor.properties file:
#following the details contains influxDB
stagemonitor.reporting.influxdb.url=http://localhost:8086
stagemonitor.reporting.interval.influxdb=60
stagemonitor.reporting.influxdb.username= value
stagemonitor.reporting.influxdb.password=value
Logs Monitoring using Kibana/Stagemonitor
We can track logs using Kibana/Stagemonitor. In the metrics dashboard, we can see matrices such as what URL address we’ve hit and the time to complete the request (Figure 2). We can track the host details such as how many servers our applications are running, the status of the server, memory stats, CPU stats, network stats, disk usage stats, networks processed, network packets errors, network packets dropped and how many cores of the CPU the host is using.
Stagemonitor provides all the required dashboards under the request analysis dashboard. To open the request analysis dashboard, click on: Dashboard – Load Saved Dashboard and select “Request Analysis.”
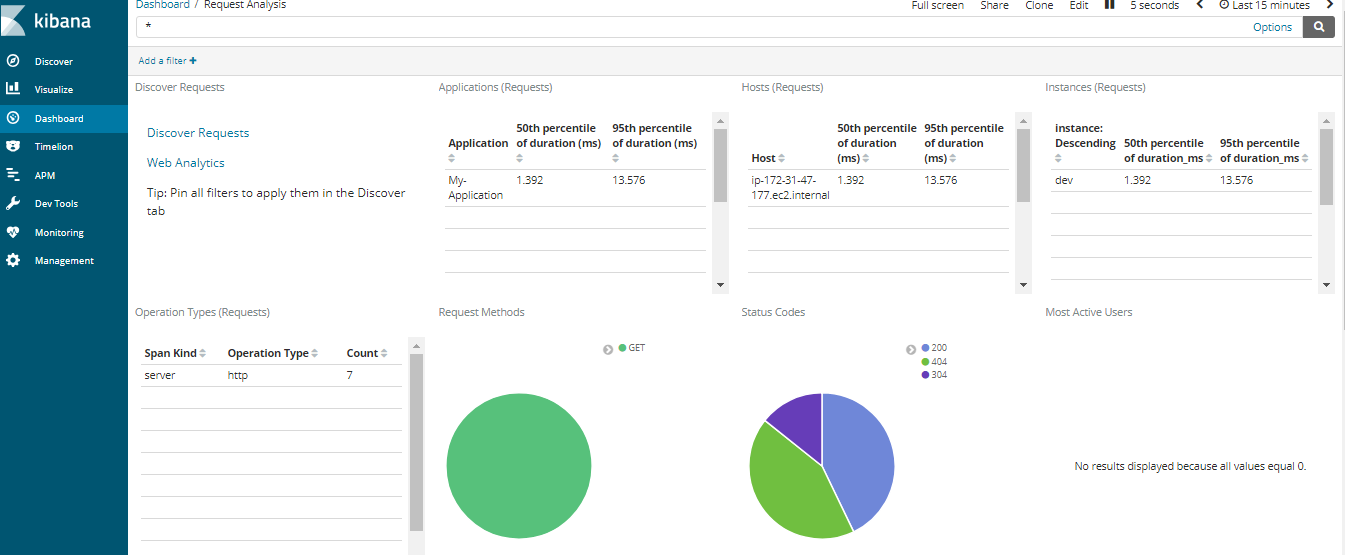
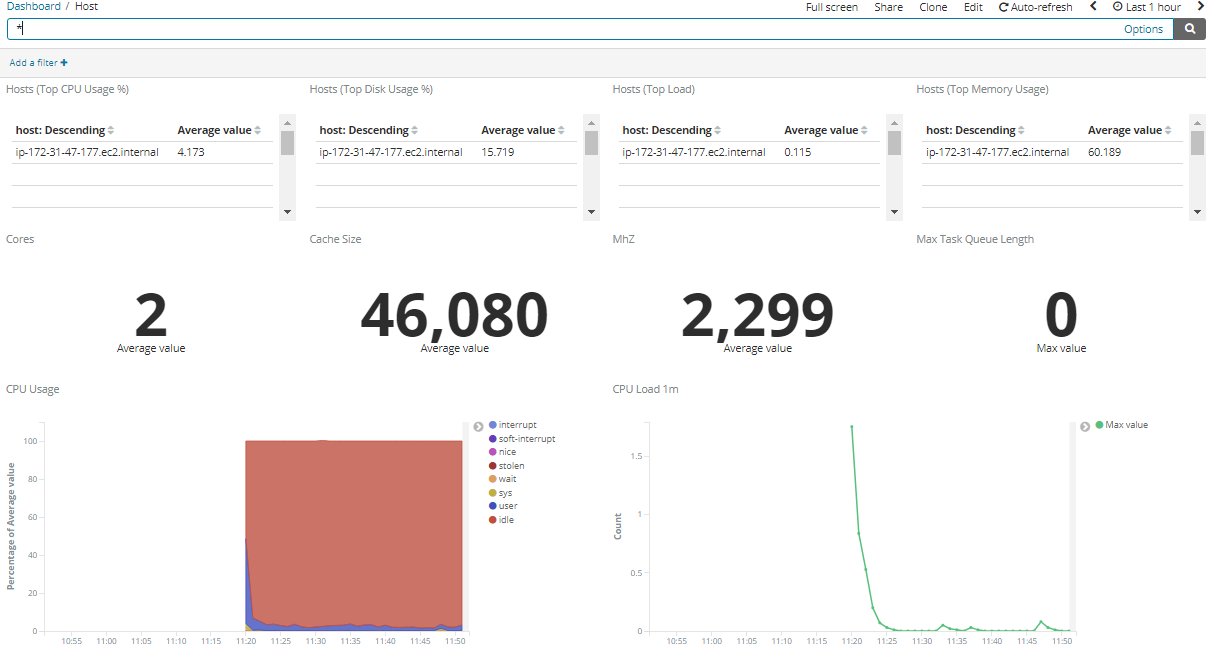
Figure 3 shows the details of the CPU, such as CPU usage and CPU load.
Below, Figure 4 shows total page views, unique number of visitors to the site and call tree, and how much time it takes to complete.
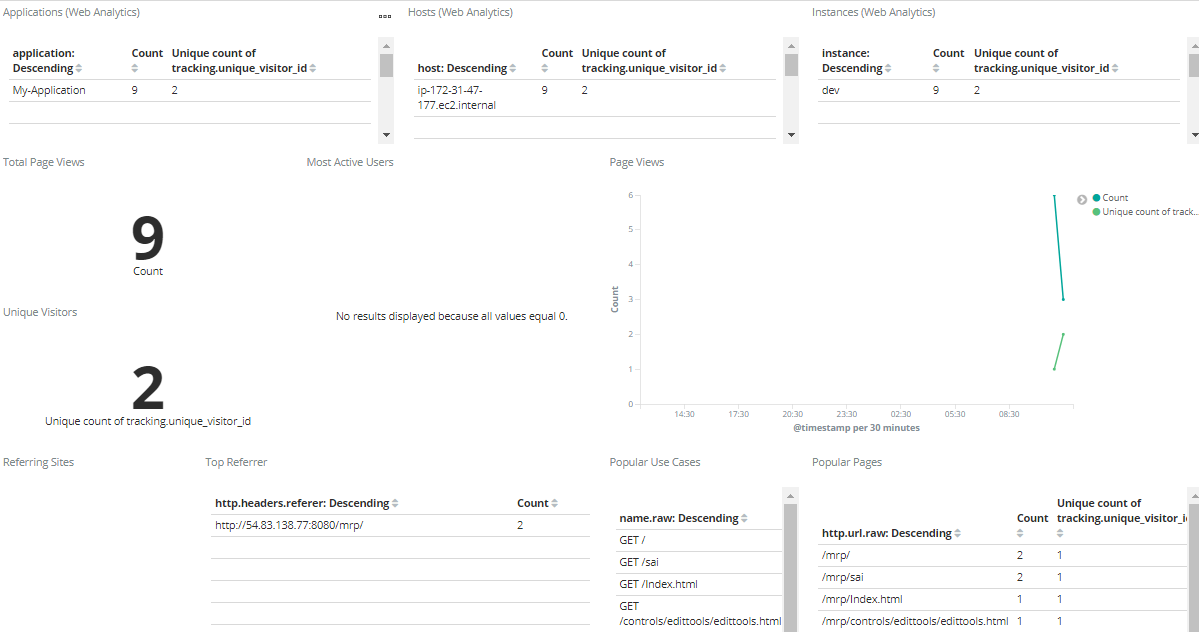
Figure 5 shows the transaction history and individual transaction details.
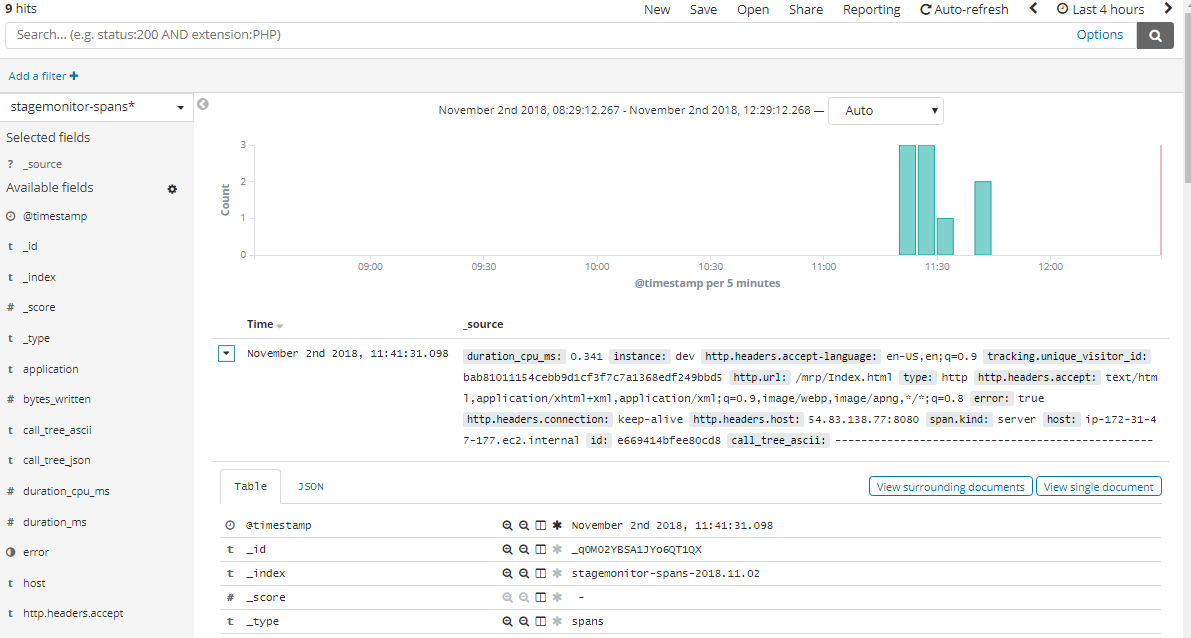
Figure 6 shows the JVM details and all the other memory matrices.
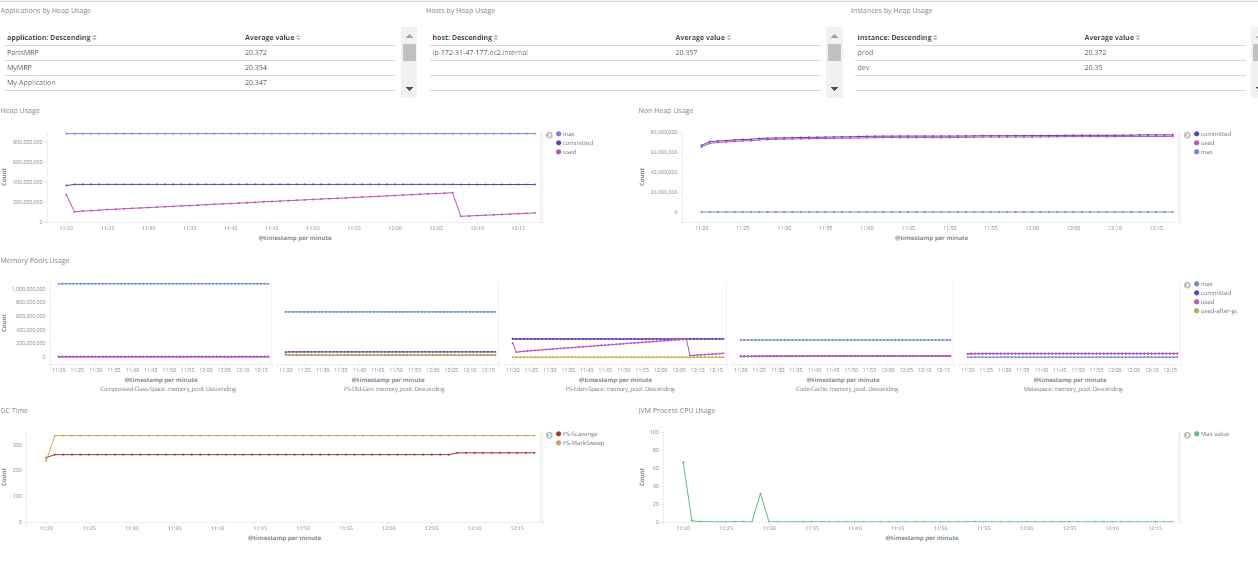
As mentioned above, we can monitor various application metrics and infrastructure metrics.


