New Relic announced today it has added a visualization tool, dubbed New Relic Explorer, to make it simpler for IT professionals to discover the root cause of issues that adversely affect application performance.
Buddy Brewer, global vice president and field CTO for the Americas, New Relic, said the goal is to make it simpler for IT professionals to navigate and, ultimately, act on, all the metrics collected by the New Relic One observability platform.
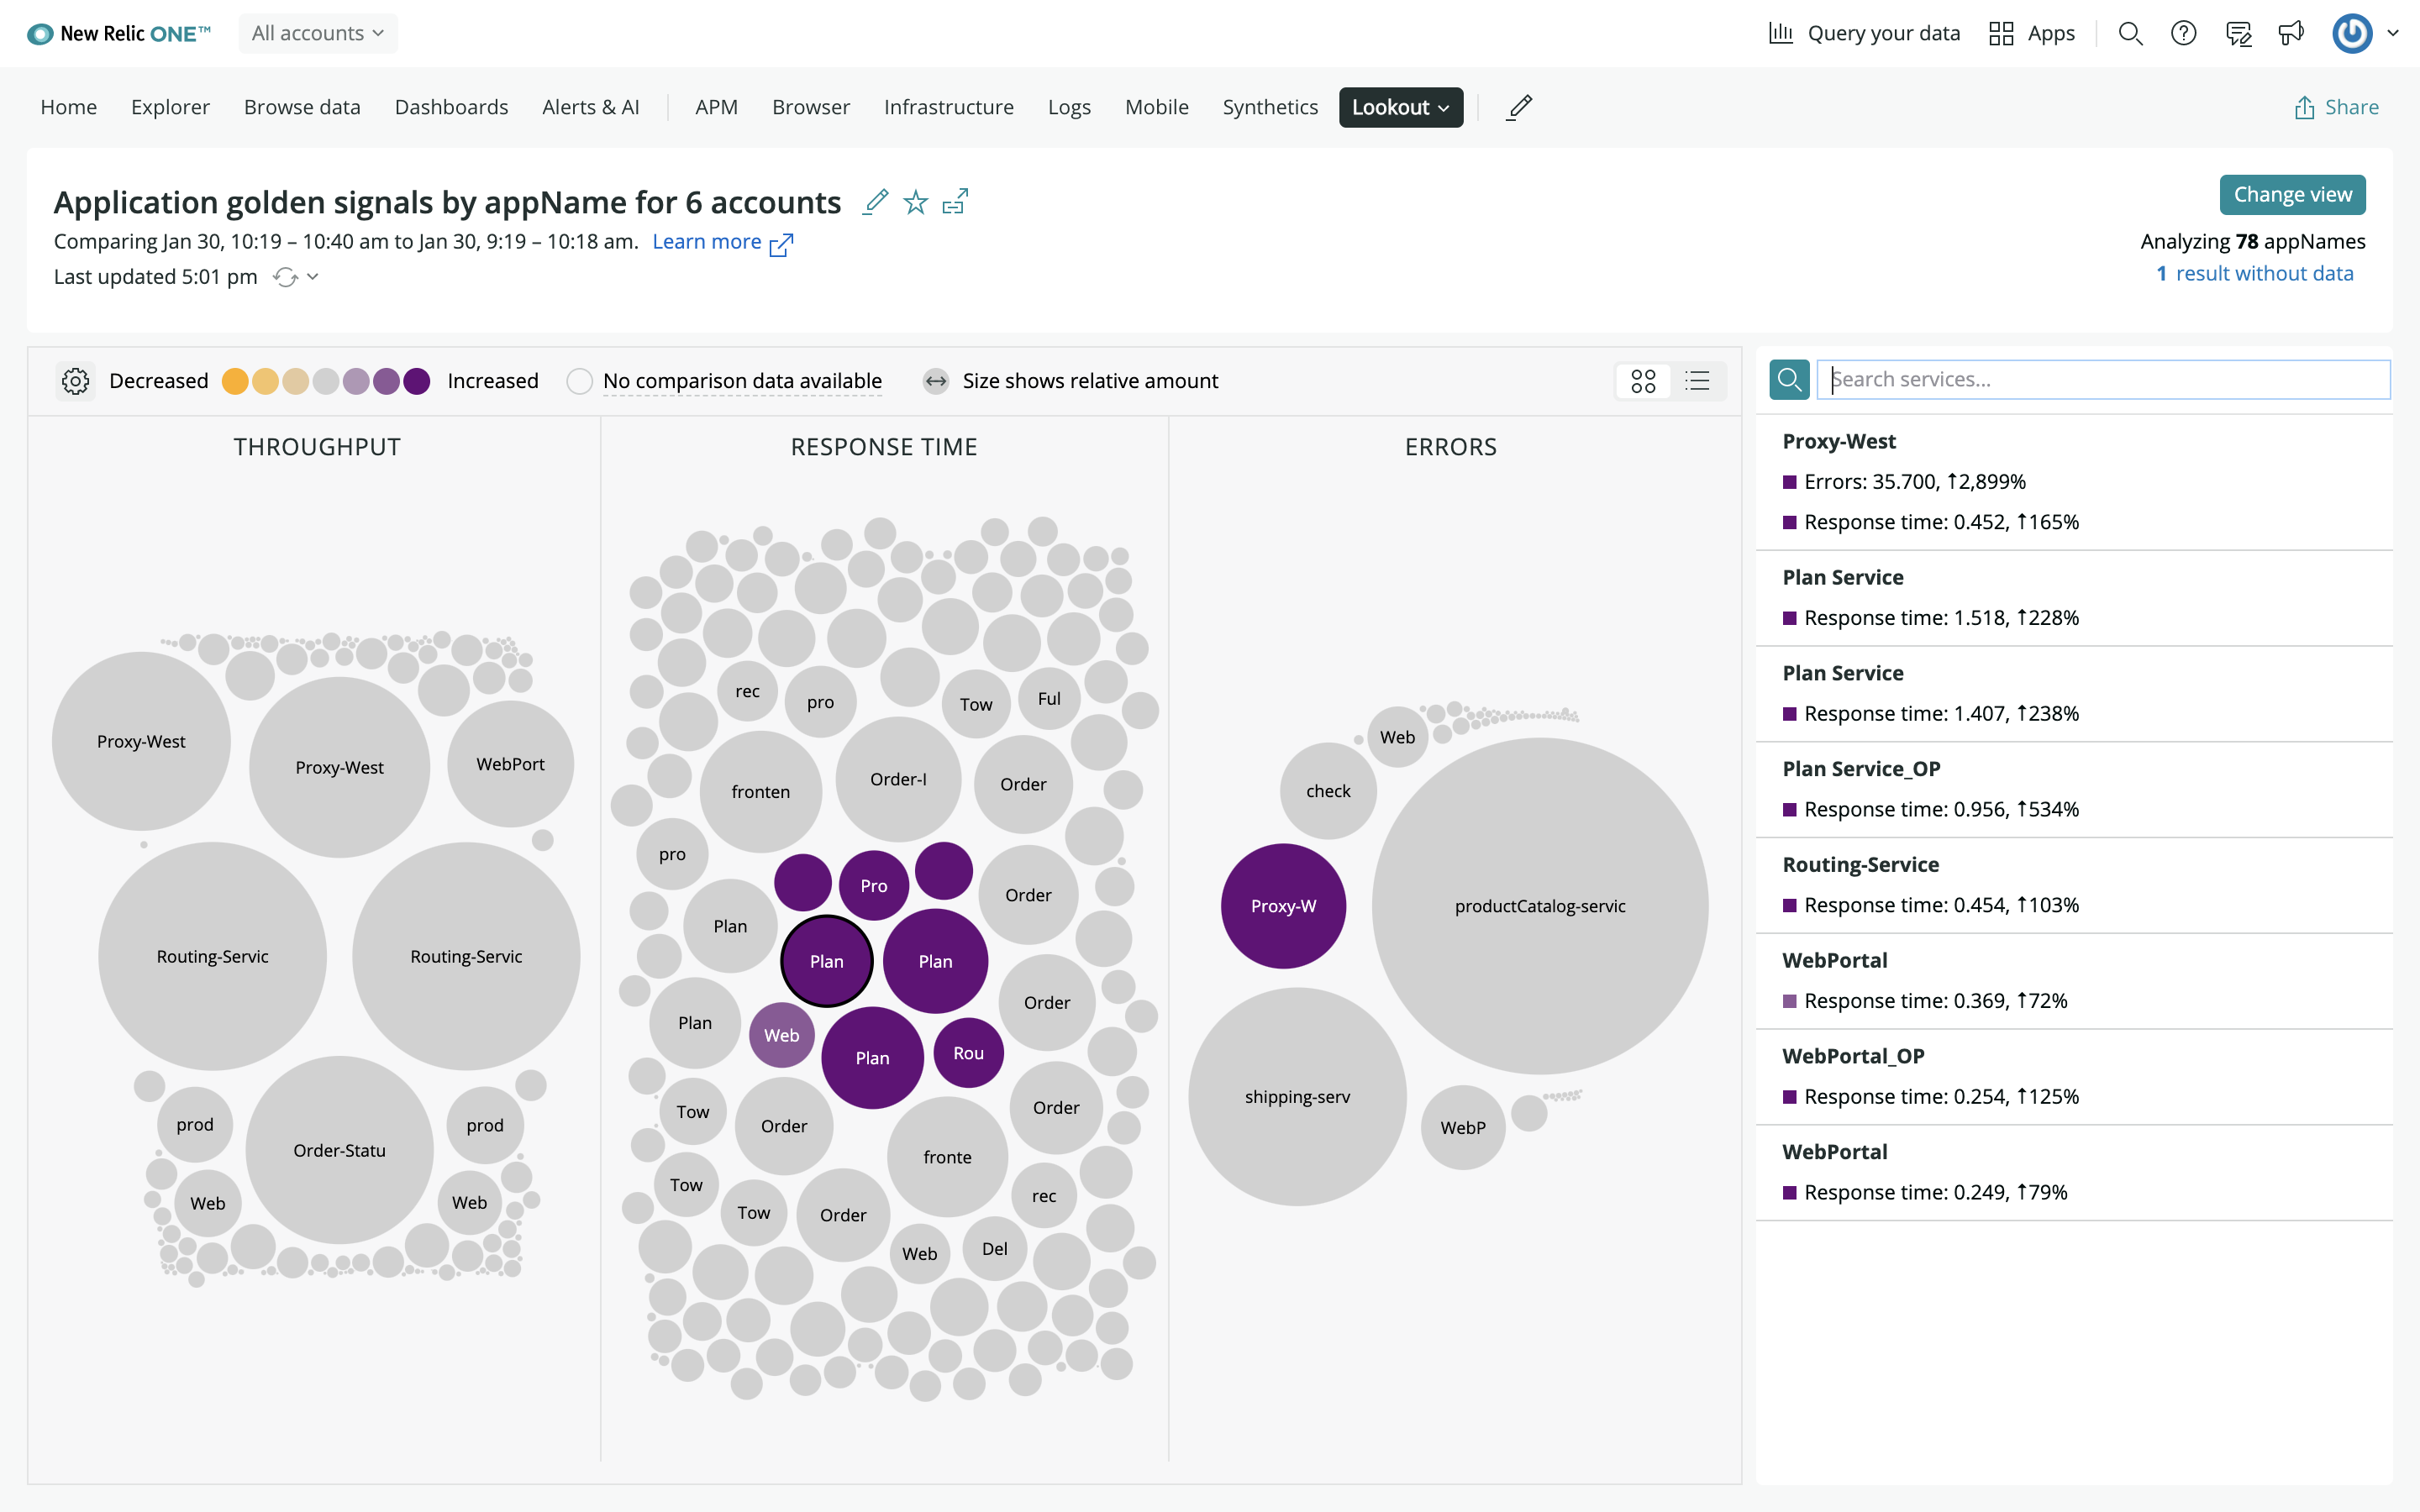
New Relic Explorer includes a New Relic Lookout capability that enables IT teams to drill down into telemetry data gathered from New Relic One, as well as other third-party sources, and a New Relic Navigator capability for determining the health of relationships between services, said Brewer. These capabilities make it possible to more easily identify correlations, abnormal history and traces that would be, for example, indicative of blind spots or unknown relationships between IT services, Brewer said.
Just as importantly, IT professionals can more easily discover recent changes to an IT environment, which are most likely the cause of any new issue that is adversely affecting the IT environment, Brewer added.
New Relic Explorer requires no configuration, and will be included as part of the existing New Relic Full-Stack Observability offering to give IT teams a single unified view of their IT environments, said Brewer.
As IT environments become more complex, the amount of time spent looking for the root cause of an issue that might only take a few minutes to fix has substantially increased. As a result, organizations are allocating a significant amount of time to convene “war rooms” to identify the source of problems; those problems can now be more readily identified using New Relic Explorer.
In general, Brewer said, New Relic remains committed to opening up the platform to external telemetry sources, including data collected using open source tools, such as Prometheus and OpenTelemetry agent software, both advanced under the auspices of the Cloud Native Computing Foundation (CNCF).
New Relic, like providers of similar tools, has recently begun repositioning itself as a provider of an observability platform, rather than of application performance management (APM) tools, that provides insights into both applications and the infrastructure on which they depend. That approach promises to provide IT teams with more context any time an issue arises. As part of that shift, New Relic is making it clear that while it views its agent source as a richer source of telemetry data, its platform can consume relevant data wherever it can be found. New Relic will also remind customers that its agent software, and the other data collection tools it provides, are simpler to install and update.
The tradeoff, of course, is cost. While open source software itself is free, the total cost of implementing and managing that open source software can be substantial. Regardless of approach, however, the days when IT teams only applied application monitoring tools to their most mission-critical applications because of cost concerns are coming to an end. It has become impossible to manage a modern IT environment made up of both monolithic and microservices-based applications without such capabilities.
